
Figure 2.
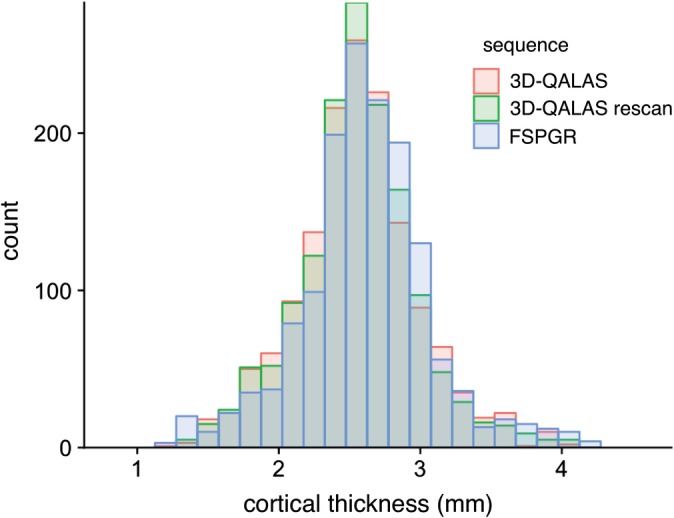
Histograms of cortical thicknesses derived from 3D‐QALAS scan–rescan and FSPGR in all subjects measured using FreeSurfer.
Official websites use .gov
A
.gov website belongs to an official
government organization in the United States.
Secure .gov websites use HTTPS
A lock (
) or https:// means you've safely
connected to the .gov website. Share sensitive
information only on official, secure websites.
Histograms of cortical thicknesses derived from 3D‐QALAS scan–rescan and FSPGR in all subjects measured using FreeSurfer.