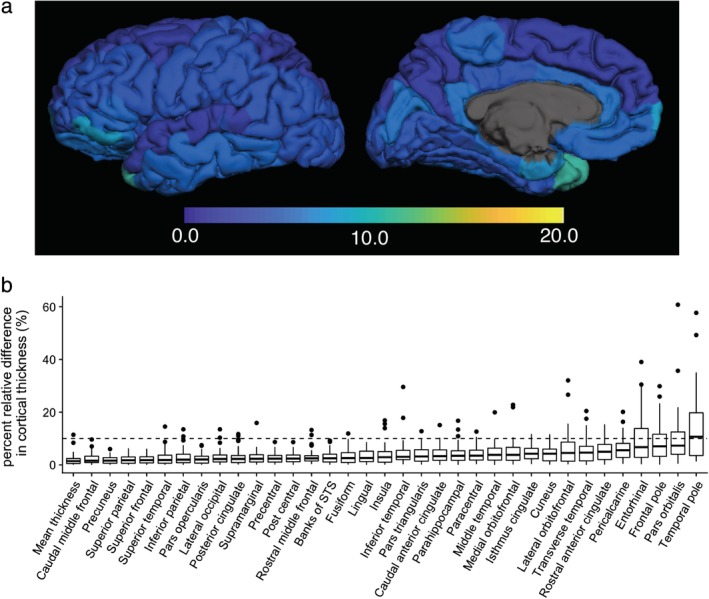
Figure 4.

Percent relative difference in cortical thickness for 3D‐QALAS scan–rescan, measured using FreeSurfer. Regional percent relative difference is overlaid on an inflated brain surface (a). Median values and interquartile ranges are shown in boxplots (b). Whiskers are set at minimum and maximum, and the horizontal line marks the median. Boxes indicate the interquartile range (25–75%). Dots at the end of the boxplot represent outliers.
