
Figure 5.
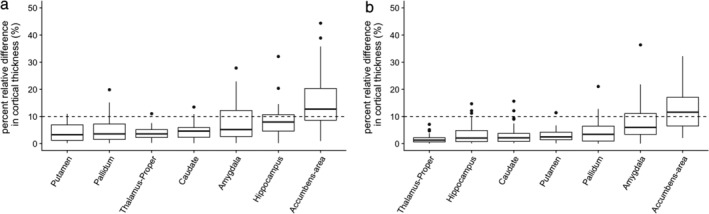
Percent relative difference of subcortical volumes measured using FIRST. (a) and (b) show comparisons between 3D‐QALAS and FSPGR, and scan–rescan of 3D‐QALAS, respectively. Whiskers are set at minimum and maximum, and the horizontal line marks the median. Boxes indicate the interquartile range (25–75%). Dots at the end of the boxplot represent outliers.