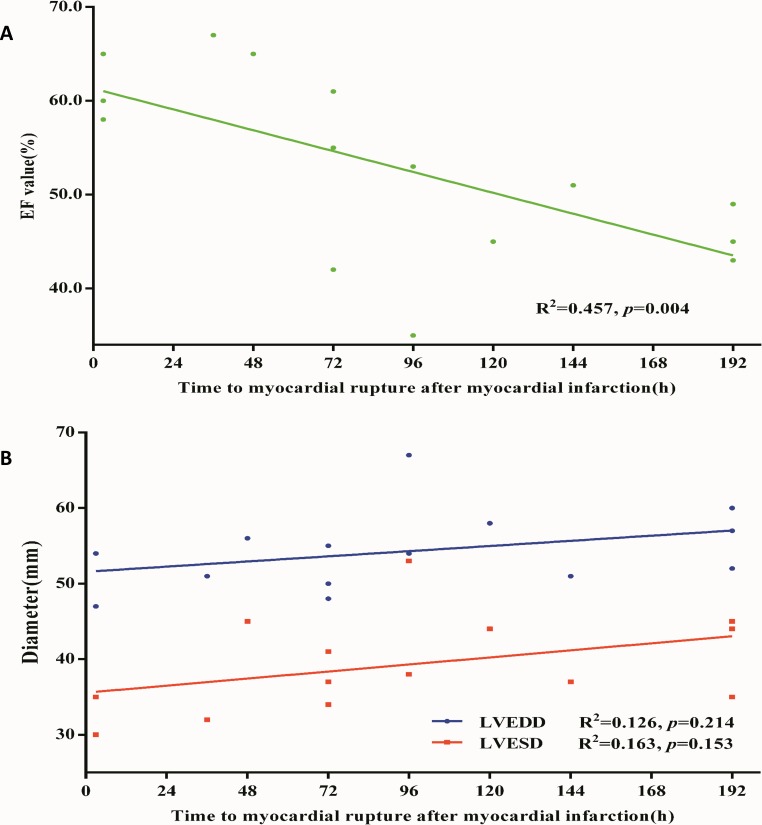
Figure 1.
Simple linear analysis between time to myocardial rupture and cardiac function in patients with MI. (A) Simple linear regression model with time to myocardial rupture after MI in relation to the EF value. The y-axis represents the EF value (%) evaluated by echocardiography. The x-axis represents time to myocardial rupture. Green dots stand for EF value in each patient. 15 patients with MI were enrolled in the analysis (R2=0.457, 95% CI of slope −0.151 to −0.035, p=0.004). (B) Simple linear regression model with time to myocardial rupture after MI in relation to LVEDD/LVESD. The y-axis represents the diameter (mm) evaluated by echocardiography. The x-axis represents time to myocardial rupture. Green dots stand for EF value in each patient. 14 patients with MI were enrolled in the analysis (LVEDD: R2=0.126, 95% CI of slope −0.019 to 0.076, p=0.214; LVESD: R2=0.163, 95% CI of slope −0.017 to 0.095, p=0.153). EF, ejection fraction; LVEDD, left ventricular end-diastolic dimension; LVESD, left ventricular end-systolic diameter; MI, myocardial infarction.

