Figure 1.
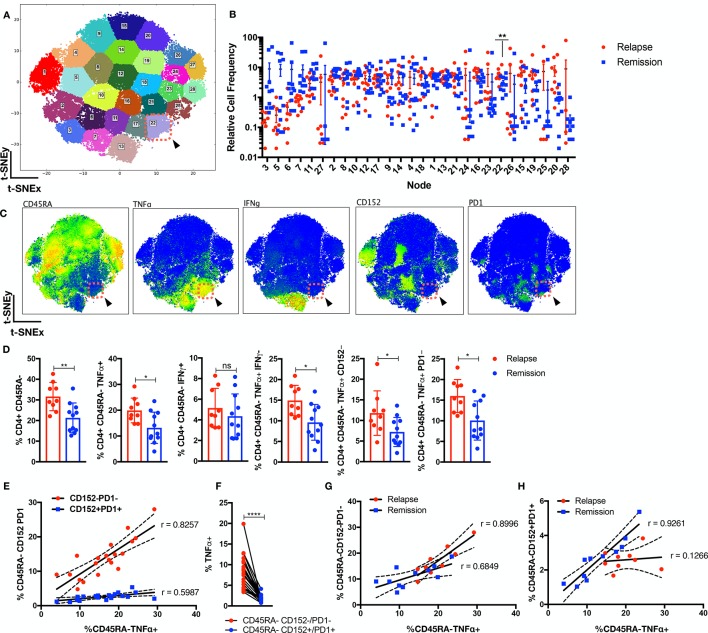
Perturbation in CD4 landscape in patients with JIA who will relapse. Circulatory CD3+CD4+ cells from patients with JIA (n=20; relapse=9, remission=11) prior to therapy withdrawal were stained with 31 functional markers in cytometry by time of flight and were dimensionally reduced onto a bivariate X–Y axis scale with t-SNE. (A) The t-SNE map is segregated into 28 distinct nodes with k-means, and node 22 is highlighted (red-dotted box). (B) The distribution of relative cell frequency in relapse or remission patients across the nodes is shown, with node 22 significantly higher (p<0.01) in relapse individuals. (C) The phenotypic expression of markers is shown for node 22 (red-dotted box). (D) Supervised gating of the preclustering FCS files validates the relevant CD4 memory cellular subsets in relapse versus remission individuals. (E) Correlation analysis of CD45RA−TNFα+ versus CD45RA−CD152−/PD1− or CD45RA−CD152+/PD1+ as percentage of CD3+CD4+ cells across patients with JIA. (F) Percentage of TNFα+ cells in CD45RA−CD152−/PD1− or CD45RA−CD152+/PD1+ compartment. Correlation analysis of CD45RA−TNFα+ versus (G) CD45RA−CD152−/PD1− or (H) CD45RA−CD152+/PD1+ as percentage of CD3+CD4+ cells across relapse or remission patients. Comparison of cellular subsets performed with Mann-Whitney U, unpaired or paired two-tailed test, means±SD. *p<0.05, **p<0.01, ****p<0.0001. Correlation analysis performed with Pearson correlation, two-tailed test. IFN, interferon; TNFα, tumour necrosis factor alpha; t-SNE, t-distributed stochastic neighbour embedding.

