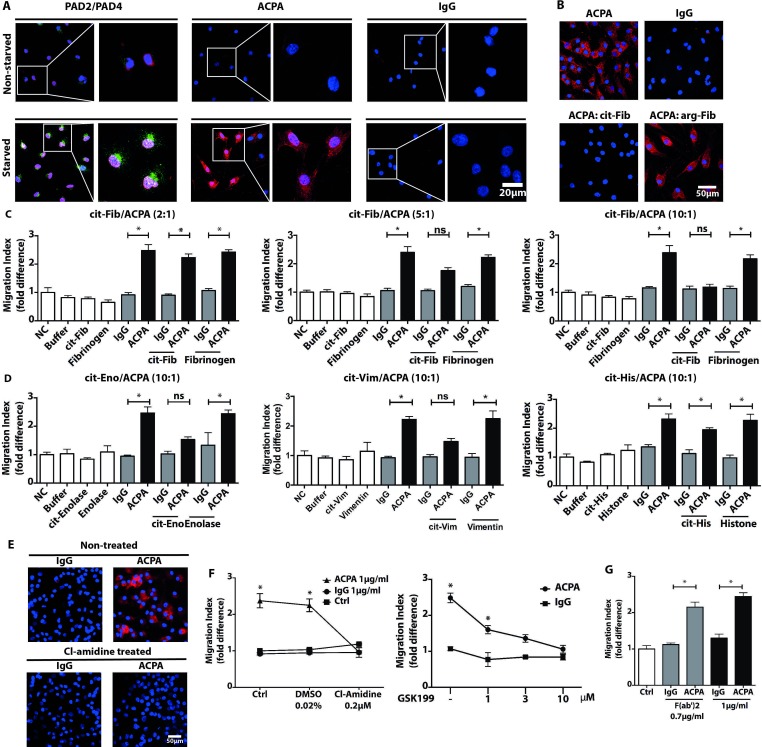
Figure 2.
Starvation-induced protein citrullination is essential for synovial fibroblast migration induced by ACPAs. Confocal microscopy images visualise PAD-2 (green) and PAD-4 (red) expressions as well as polyclonal ACPA IgGs (ACPA) and non-ACPA control IgG (IgG) binding patterns in FLS cultures following serum withdrawal (starved) or in non-starved FLS, in the presence of 10% fetal bovine serum (A). An original magnification of 400x was used for all images obtained with confocal microscopy and nuclei are shown in blue. Starved FLS cultures were also stained with ACPAs (red colour) pre-incubated overnight with citrullinated (cit) or native fibrinogen with ratio of protein:antibody (10:1) (cit-Fib or Arg-Fib, respectively) or in the absence of fibrinogen (B). To block ACPA-induced migration, FLS migration was compared in the presence of 1 µg/mL polyclonal ACPAs and control IgG or with both antibodies pre-incubated with citrullinated or native fibrinogen in the indicated ratio overnight. Migration index was calculated from three independent experiments, using cells of three individual patients and six replicates for each treatment, mean±SD values are shown (C). Similar blocking experiments were performed with citrullinated vimentin (Vim), enolase (Eno) and histone 4 (His) using 10:1 decoy protein:antibody ratio. The graphs represent results obtained from three independent experiments, using cells of three individual patients and six replicates (D). To inhibit PAD enzymes, we exposed FLS cultures to 200 nM Cl-amidine for 72 hours. Confocal microscopy images show the inhibition of ACPA binding (red colour) to Cl-amidine pretreated FLS (E). Moreover, after pre-incubation of the cells with different PAD inhibitors, Cl-amidine and GSK199, we could not detect an increased FLS mobility in the presence of ACPAs (F). Migration index was calculated from three independent experiments, using cells of three individual patients and six sample-replicates, mean±SD values are shown. Furthermore, FLS migration were analysed in the presence of 0.7 µg/mL polyclonal ACPA F(ab’)2 and non-ACPA IgG F(ab’)2. The graph indicates results obtained from three independent experiments, using cells of three individual patients and six replicates (G). *P<0.05. ACPA, anticitrullinated protein/peptide antibody; DMSO, dimethyl sulfoxide; FLS, fibroblast-like synoviocytes; PAD, protein arginine deiminase; ns, not significant.

