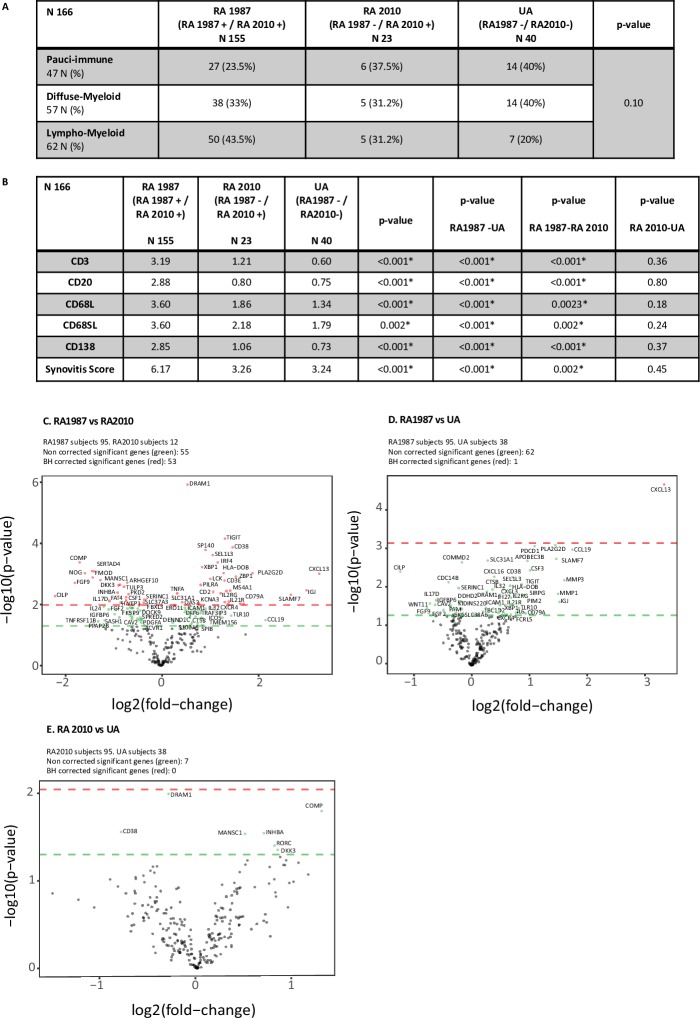
Figure 3.
Variation in synovial pathobiology according to clinical classification of patients. (A) Baseline clinical classification compared with pathotype. Baseline subgroups (RA1987, RA2010 and UA) were compared with pathotype. Fisher test used for analysis. (B) Immune cell infiltration for each clinical subgroup. Kruskal-Wallis test for comparison between three groups. Post hoc analysis for significant differences using the Dunn test for multiple comparison. (C) (C–E) Gene expression analysis for comparison between subgroups. t-Test for comparison and volcano plot for representative image. Positive values represent upregulation and negative values downregulation. Green circles above green horizontal line represents non-corrected for multiple analysis expressed genes between groups. Red circles above red line represents corrected p values (Benjamini-Hochberg (BH) method) for multiple analysis. (C) Volcano plot RA1987 versus RA2010: difference in gene expression between patient fulfilling RA 1987 ACR criteria and RA 2010 ACR/EULAR criteria. (D) Volcano plot RA1987 versus UA: difference in gene expression between patient fulfilling RA 1987 ACR criteria and UA. (E) Volcano plot RA 2010 versus UA: differences in gene expression between patient fulfilling RA 2010 ACR/EULAR criteria and UA. RA, rheumatoid arthritis; UA, undifferentiated arthritis.

