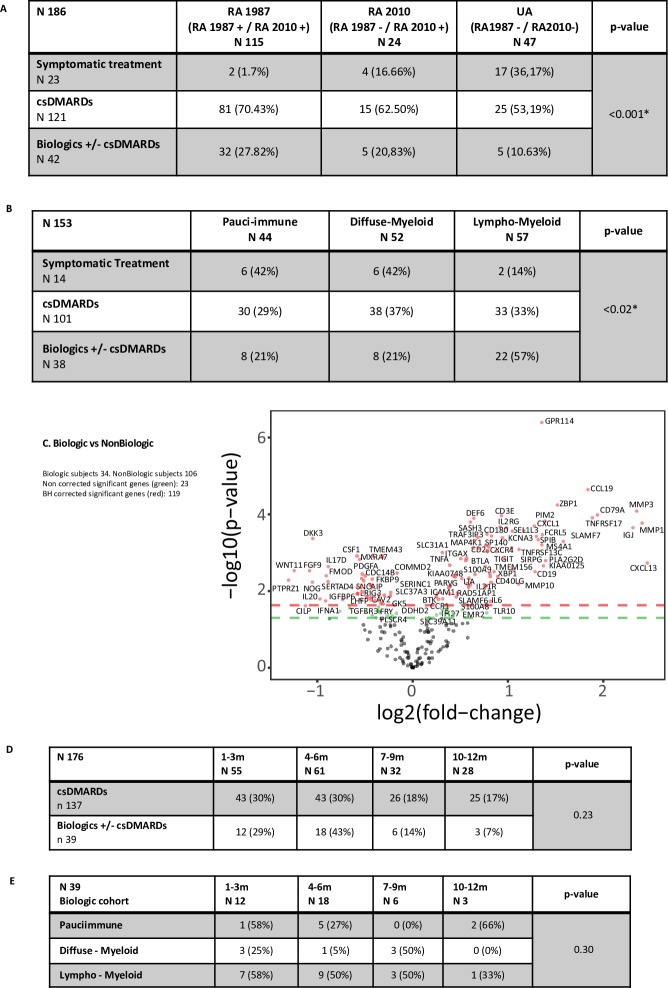
Figure 5.
(A) Comparison between diagnostic subgroups and treatment outcome at 12-month follow-up. Treatment required was divided in three groups: (1) no treatment; (2) csDMARDs only, and (3) csDMARDs ±biologics. Fisher test for analysis. (B) Comparison between pathotype and treatment outcome at 12 months. (C) Gene expression analysis, represented in a volcano plot comparison between patient requiring biologics versus non-biological group. t-Test comparison for gene difference expression between groups. Positive values represent upregulation and negative values downregulation. An adjusted (Benjamini-Hochberg (BH) correction for multiple analysis) p value of <0.01 was considered statistically significant, represented as dots above red line. Green dots above green line for gene expression significance when no correction applied for multiple analysis (p<0.05). (D) Treatment outcome according to baseline disease duration. Fisher test for analysis. (E) Pathotype according to baseline disease duration for biological patient cohort. Fisher test for analysis. A p value of <0.05 was considered statistically significant unless otherwise stated. RA, rheumatoid arthritis; UA, undifferentiated arthritis.

