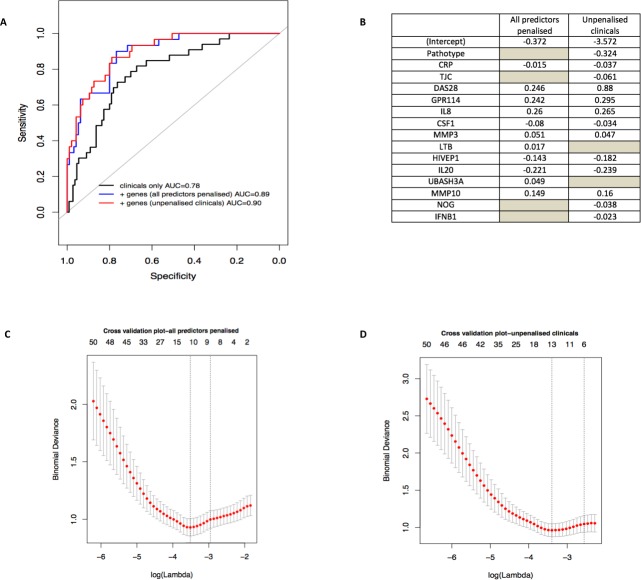
Figure 6.
Prediction model. (A) and (B) Identification of clinical and gene expression features predictive of biological therapy use at 1 year. Logistic regression, coupled with backward and stepwise model selection, was applied to baseline clinical parameters against a dependent variable of biological therapy use or not at 12 months to select which clinical covariate contributed the most to the prediction. Selected covariates (119 genes+4 clinical covariates) were entered simultaneously into a logistic model with an L1 regularisation penalty (LASSO) in order to determine the optimal sparse prediction model. A similar predictive performance of the model when clinical was seen when results were penalised (blue-dashed line, A) than when they were not penalised (red-dotted line, A) with a slightly different set of selected covariates (B). (B) Non-zero weights associated with the final variables selected by the LASSO regression. The grey spaces represent the variables that were not selected by the model. (C) and (D) Lambda training curve from the final glmnet fitted model. The red dots represent mean binomial deviance using 10-fold cross validation. The error bars represent SE of binomial deviance. The vertical dotted lines indicate minimum binomial deviance (λmin) and a more regularised model for which the binomial deviance error is within one SE of the minimum binomial deviance (λ1se). λmin was selected, corresponding to 11 non-zero coefficients in the final model for the LASSO where clinical were penalised (C) and 13 non-zero coefficients in the final model for the LASSO where clinical were not penalised (D). AUC, area under the receiver operating characteristic curve; CRP, C reactive protein; DAS28, Disease Activity Score 28 joints; TJC, tender joint count.

