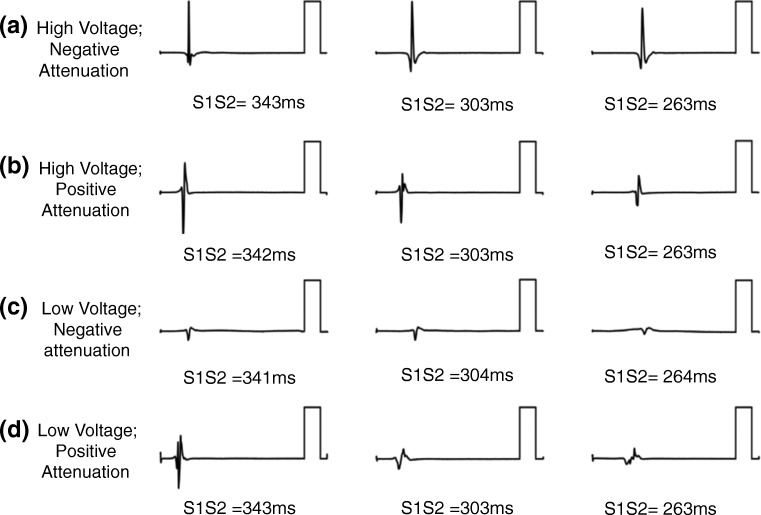
Fig. 5.
Bipolar voltage attenuation at decreasing coupling intervals: Four unique patterns found when measuring voltage amplitude during decreasing coupling intervals in patients with otherwise ‘normal’ voltage (> 0.3 mV at CL 470 ms). (a) High initial voltage without attenuation. (b) Voltage with attenuation that plateaus above 1 mV. (c) Initial low voltage without attenuation. (d) Voltage which attenuates to a low plateau (< 1 mV) [101]

