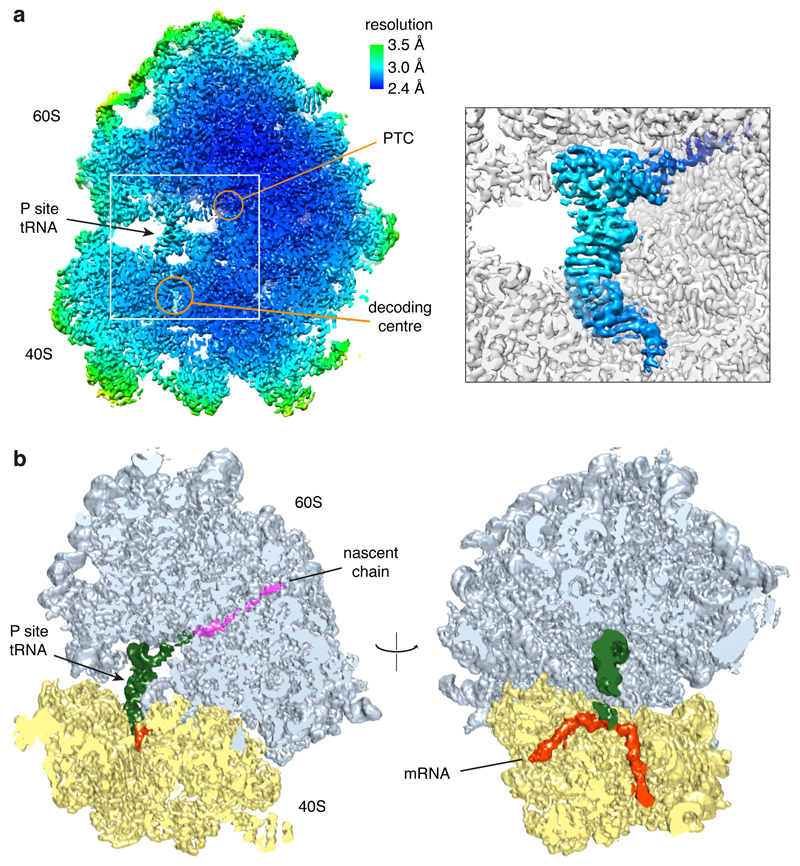
Extended Data Fig. 3. Characterization of cryo-EM map.
(A) Local resolution of the poly(A)-stalled ribosome sliced through the centre. The positions of key elements are indicated. PTC: peptidyl-transferase centre. Inset (right) highlights the high local resolution at the PTC and decoding centre (B) Slices through the density map at the plane of the polypeptide exit tunnel (left) and mRNA channel (right). Continuous nascent chain density corresponding to a mixture of poly-Lys lengths and Cα positions is contoured at a different level to the rest of the map and is shown in magenta, and mRNA density is shown in red. The P site tRNA is green, 40S subunit in yellow, and 60S subunit in light blue.

