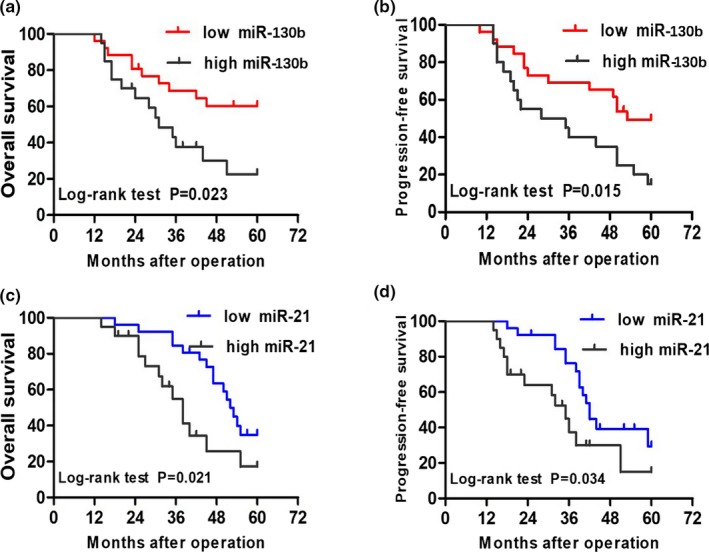
Figure 2.

Association of serum miR‐130b and miR‐21 expression of overall and progression‐free survival. (a and b) Kaplan–Meier graphs representing the probabilities of overall survival and progression‐free in cholangiocarcinoma patients according to the expression level of miR‐130b, respectively. (c and d) Kaplan–Meier graphs representing the probabilities of overall survival and progression‐free in cholangiocarcinoma patients according to the expression level of miR‐21, respectively. Two‐tailed Student's t test was used to analyze the significant differences
