Figure 6.

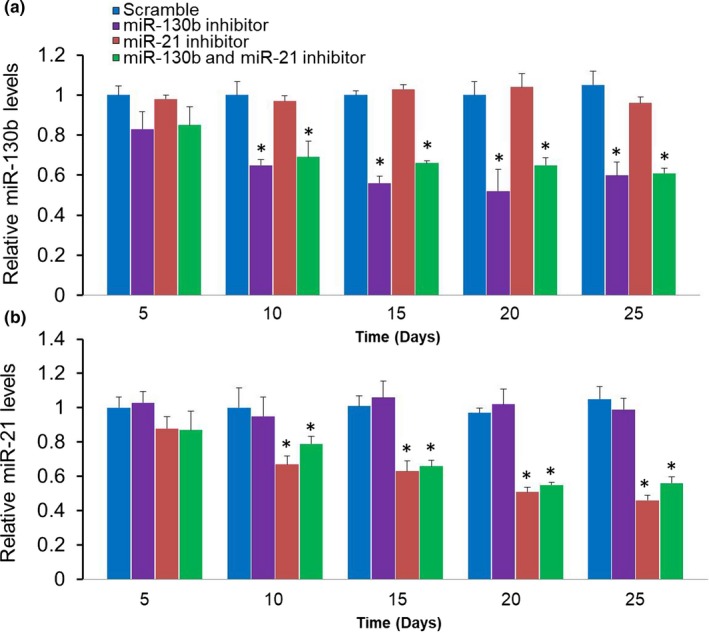
Circulating miRNAs levels in each time point after treated with different complexes. (a) The miR‐130b expression levels from the blood serum of mice treated with different complexes. (b) The miR‐21 expression levels from the blood serum of mice treated with different complexes. *p < .05 as compared with scramble groups. Data represent the results of three independent experiments. miRNAs, microRNAs
