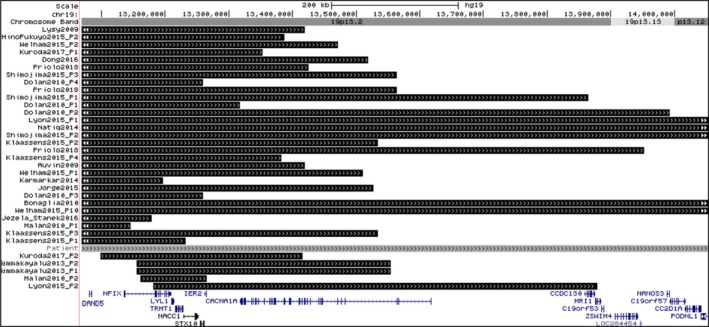
Figure 2.

Genome map of the overlapping deletions of our patient (gray bar) and previously reported cases (black bars), and known genes in the chromosome 19p13 region. The patients` rearrangements were organized based on their initial deletion coordinates. Data were uploaded to UCSC genome browser, NCBI Build 37, February 2009, hg19 Assembly (http://www.genome.ucsc.edu)
