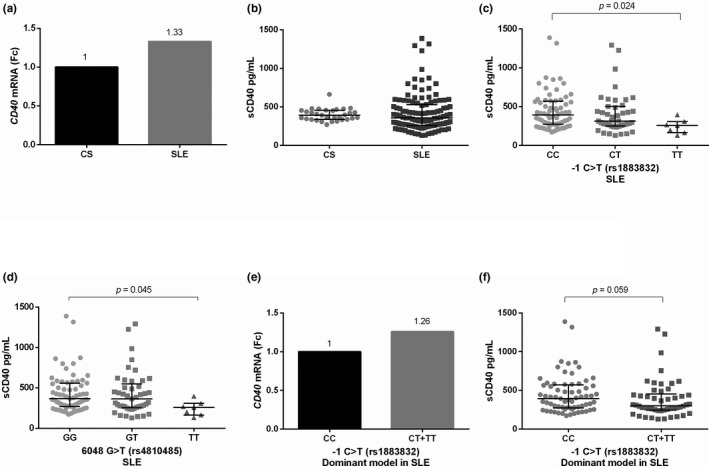
Figure 1.

CD40 gene expression and sCD40 levels according to −1 C > T (rs1883832) and 6,048 G > T (rs4810485) polymorphisms. (a) CD40 gene expression in CS and SLE patients, (b) sCD40 levels in CS and SLE patients, (c) and (d) sCD40 levels according to −1 C > T (rs1883832) and 6,048 G > T (rs4810485) genotypes; (e) CD40 gene expression according to dominant model of −1 C > T (rs1883832) polymorphism in SLE patients, and (f) sCD40 levels according to dominant model of −1 C > T (rs1883832) polymorphism in SLE patients. The qualitative gene expression analysis was obtained through to Pfaffl's method. Mann‐Whitney U test, Kruskal‐Wallis test, and Dunn's post hoc test were used. Fc was obtained through the 2‐ΔΔCq method. Data are shown in median and IQR. CS: Control subjects, Fc: Fold change, IQR: Interquartile range, SLE: Systemic Lupus Erythematosus
