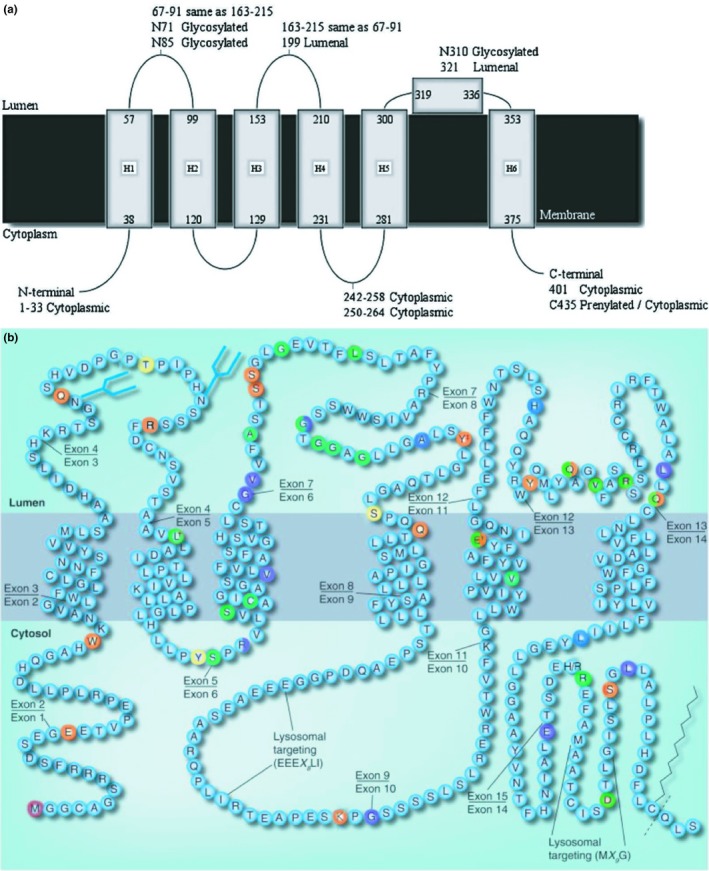
Figure 2.

2a and 2b: 2a Schematic model for human CLN3 showing the six transmembrane helices, proposed amphipathic helix and experimentally determined loop locations. 2b The predicted topology of CLN3 is depicted. Sites for post‐translational modifications are shown as blue forked lines for N‐glycosylation, zigzags for prenylation, and dotted lines for potential cleavage sites following prenylation. Disease‐causing mutations are colored in red, orange, yellow, green, blue, and violet. If the mutation covers multiple residues, only the first residue is marked. (NB‐All disease‐causing mutations are not shown. For a completes list see Table 1)
