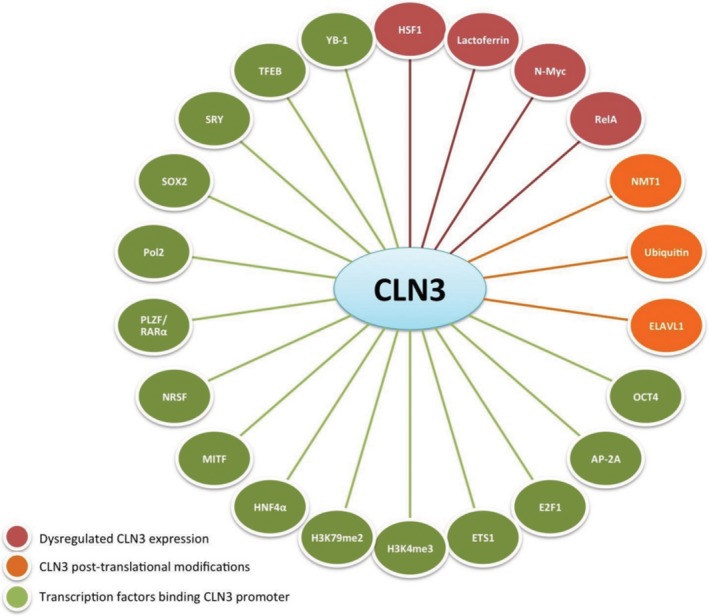
Figure 11.

Network diagram of CLN3 interactors. These interactions have been found by ChIP‐chip and Chip‐Seq analysis (Transcription factors binding CLN3 promoter), Microarray analysis (Dysregulated CLN3 expression) and Mass spectrometry analysis (CLN3 PTMs). The majority of these interactions require further validation
