
Figure 2.
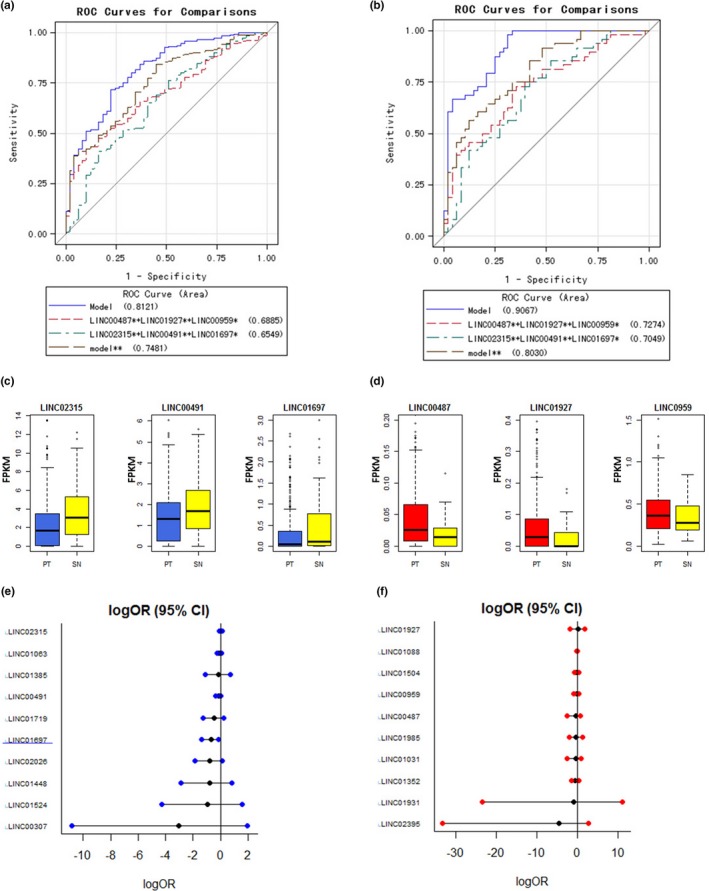
Predictive values of candidate lincRNAs in LSqCC diagnosis. (a) ROC curves for full model (20 lincRNA candidates), a small joint panel of risk lincRNAs (LINC00487 + LINC01927 + LINC00959), a small joint panel of protective lincRNAs (LINC02315 + LINC00491 + LINC01697), and joint model of risk and protective lincRNAs (model**: LINC00487 + LINC01927 + LINC00959 + LINC02315 + LINC00491 + LINC01697) in independent samples (nonpaired 453 PT samples and 48 SN tissue samples). (b) ROC curves for full model (20 lincRNA candidates), a small joint panel of risk lincRNAs (LINC00487 + LINC01927 + LINC00959), a small joint panel of protective lincRNAs (LINC02315 + LINC00491 + LINC01697), and joint model of risk and protective lincRNAs (model**: LINC00487 + LINC01927 + LINC00959 + LINC02315 + LINC00491 + LINC01697) in paired PT samples and 48 SN tissue samples. (c) The gene expression level of LINC02315, LINC00491 and LINC01697 in independent PT samples (blue) and SN tissue samples (yellow). (d) The gene expression level of LINC00487, LINC01927, and LINC00959 in independent PT samples (red) and SN tissue samples (yellow). (e) Predictive values of 10 protective lincRNA candidates in LSqCC staging. LogOR (95% CI) represents the natural logarithm transformation of OR (95% CI). (f) Predictive values of 10 risk lincRNA candidates in LSqCC staging. LogOR (95% CI) represents the natural logarithm transformation of OR (95% CI)