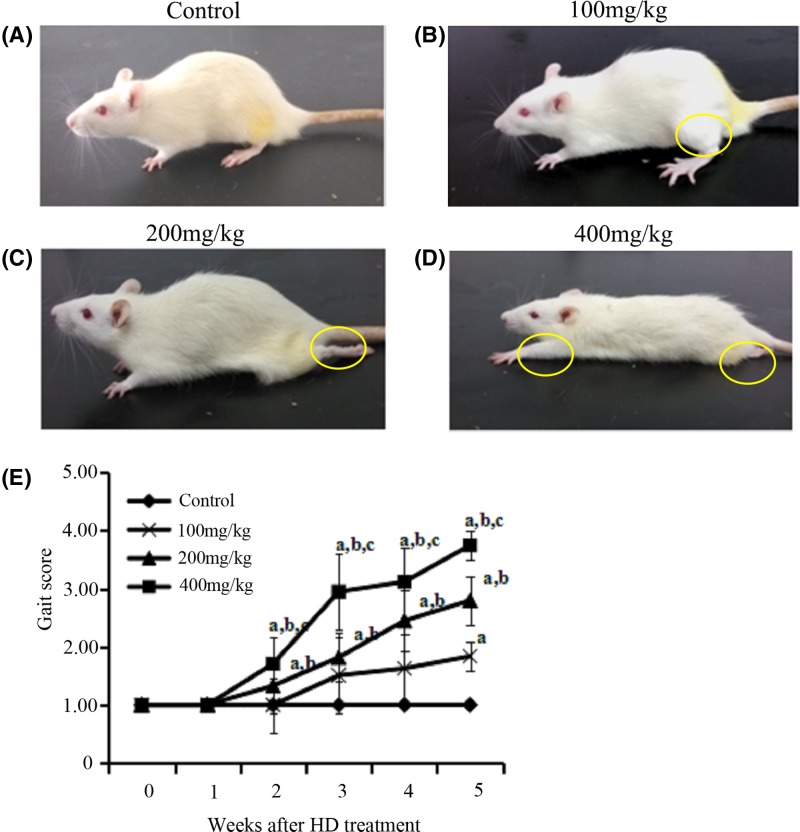
Figure 1. Behavioral assessment of animal model exposed to HD.
(A) Rat in control group. (B) Rat in group exposed to 100 mg/kg HD. (C) Rat in group exposed to 200 mg/kg HD. (D) Rat in group exposed to 400 mg/kg HD. (E) Gait scores of rats in all groups. aP<0.05, compared with the control group results; bP<0.05, compared with the results of the group that was exposed to 100 mg/kg HD; cP<0.05, compared with the results of the group that was exposed to 200 mg/kg HD.

