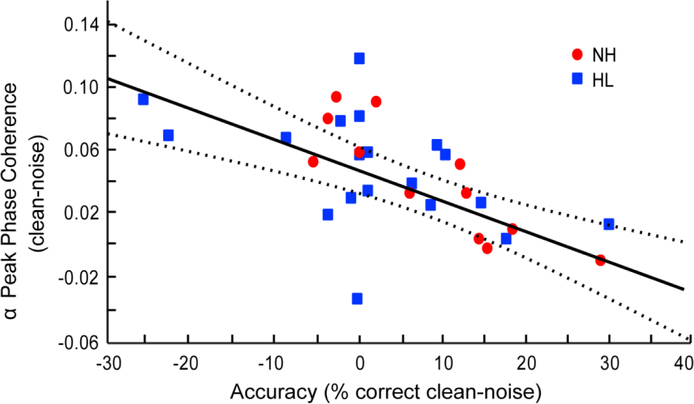
Figure 4: Phase coherence within right IFG α-band predicts accuracy of SIN performance.
Difference scores between clean and noise conditions are plotted for α phase coherence within right IFG and /ta/ detection accuracy for each participant. Greater modulations in α band are observed in listeners whose behavioral performance was more resistant to the detrimental effects of noise. Dotted lines represent the 95% confidence interval.

