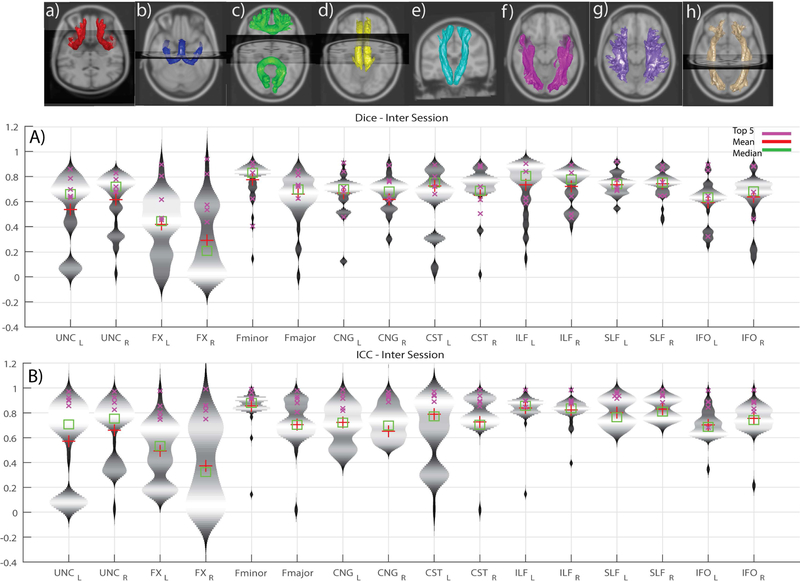
Figure 5.
Violin plots of inter-session submissions across both the scanners per tract. A) Dice similarity coefficients B) Intra-class correlation coefficients. The top row depicts the median of the top five inter session submissions. The tracts are in the following order (L/R): a) Uncinate b) Fornix c) Fminor & Fmajor d) Cingulum e) Corticospinal tract f) Inferior longitudinal fasciculus g) Superior longitudinal fasciculus h) Inferior fronto-occipital tract

