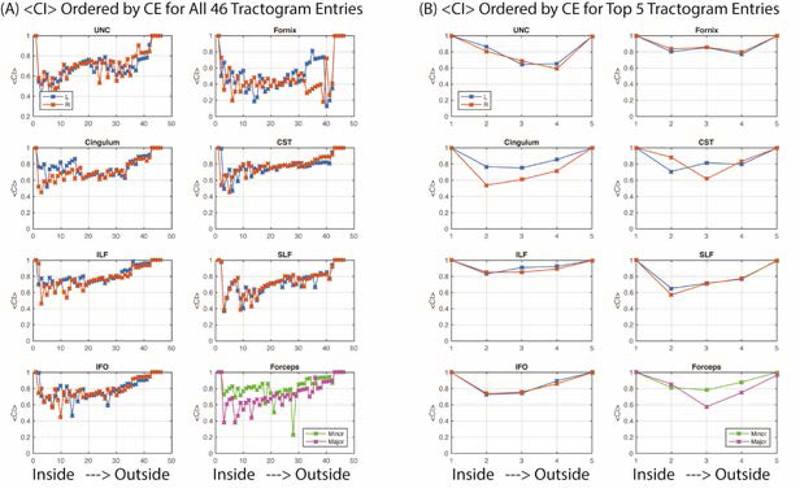
Figure 9.
Ordering entries to minimize containment energy (CE) shows that containment index is generally lower for the volumetrically smaller tractograms (toward “inside” on each subplot) and increases for the larger tractograms (toward “outside” on each subplot). Variations in containment explained the least amount of entry variability for the UNC and Fornix, while the other tracts were more consistent. The containment between all methods (A) were more variable and lower than the containment for the top five methods (B).

