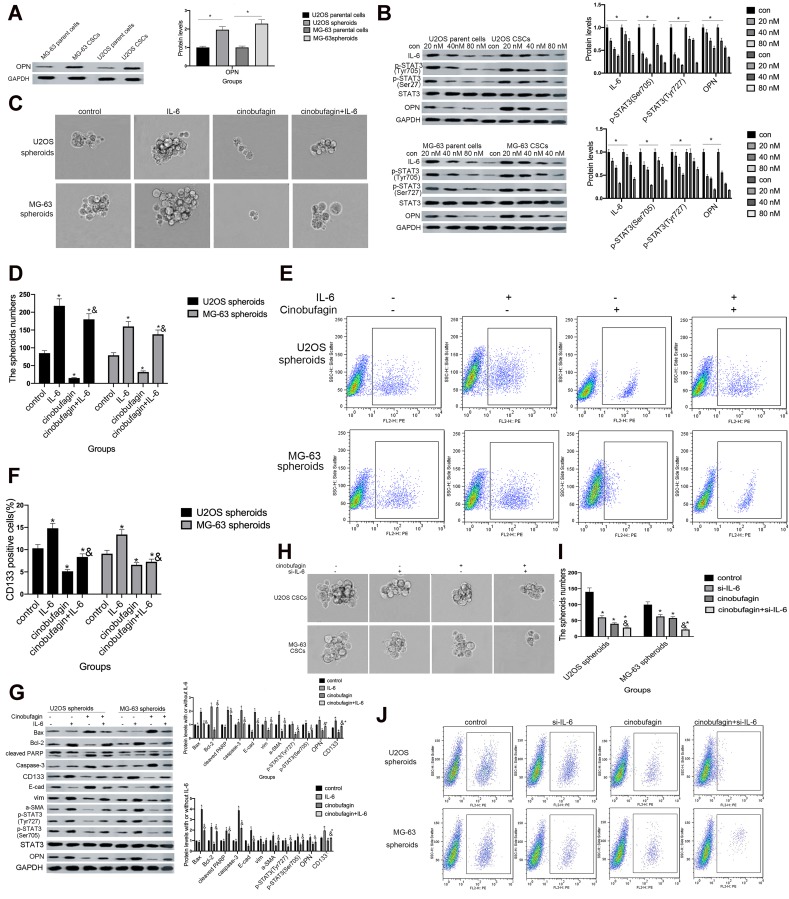
Figure 5.
The overexpression of IL-6 partly neutralized the effect of cinobufagin-diminished stem cell-like properties. (A) OPN levels in U2OS/MG-63 spheroids/parent cells as determined by Western blotting. GAPDH served as the loading control.*P < 0.05 vs. the corresponding parent cell group. (B) The expression of IL-6, p-STAT3 Tyr705 and p-JAK2 Tyr1007/1008 proteins in U2OS/MG-63 spheroids treated with cinobufagin. GAPDH was used as a loading control. Results are expressed as the mean ± SD of three independent experiments; *P < 0.05 vs. control group. (C, D) The size of MG-63/U2OS spheroids in the presence of IL-6. Spheroids were only measured when the diameter was > 50 μm. Error bars represent the mean ± SD of three independent experiments. *P < 0.05 vs. control group; &P < 0.05 vs. cinobufagin group. (E, F) Flow cytometry was used to measure the proportion of CD133-positive cells in the presence of IL-6. *P < 0.05 vs. control group; &P < 0.05 vs. cinobufagin group. (G) Western blotting was used to determine the protein levels of p-STAT3 Tyr705, p-JAK2 Tyr1007/1008, Bax, Bcl-2, caspase-3 and cleaved PARP, OPN, and CD133, in MG-63/U2OS spheroids with or without 20 μg/mL of IL-6. GAPDH was used as a loading control. Results are expressed as the mean ± SD of three independent experiments; *P < 0.05 vs. control group; &P < 0.05 vs. cinobufagin group. (H, I) The size of MG-63/U2OS spheroids in the presence of si-IL-6. Spheroids were only measured when the diameter was > 50 μm. Error bars represent the mean ± SD of three independent experiments. *P < 0.05 vs. control group; &P < 0.05 vs. cinobufagin group. (J, K) Flow cytometry was used to measure the proportion of CD133-positive cells in the presence of IL-6. *P < 0.05 vs. control group; &P < 0.05 vs. cinobufagin group. (L) Western blotting was used to determine the protein levels of p-STAT3 Tyr705, p-JAK2 Tyr1007/1008, Bax, Bcl-2, caspase-3 and cleaved PARP, CD133, and OPN in MG-63/U2OS spheroids with or without si-IL-6. GAPDH was used as a loading control. Results are expressed as the mean ± SD of three independent experiments; *P < 0.05 vs. control group; &P < 0.05 vs. cinobufagin group.

