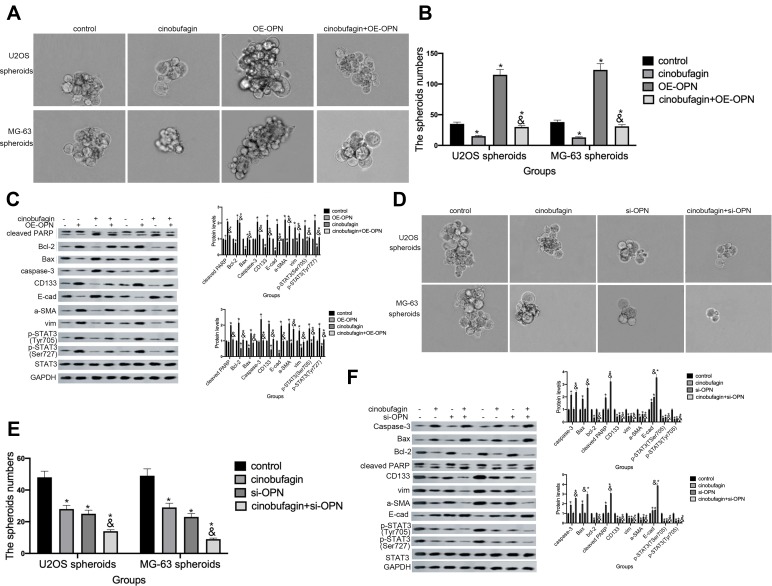
Figure 6.
Overexpression of OPN contributed to the maintenance of osteosarcoma CSCs. (A and B)The size of MG-63/U2OS spheroids in the presence of OE-OPN. Spheroids were measured when the diameter was > 50 μm. Error bars represent the mean ± SD of three independent experiments. *P < 0.05, vs. control group; &P < 0.05, vs. cinobufagin group. (C) Western blotting was used to determine the protein levels of p-STAT3 Tyr705, p-JAK2 Tyr1007/1008, Bax, Bcl-2, caspase-3 and cleaved PARP,CD133 in MG-63/U2OS spheroids with or without OE-OPN. GAPDH was used as a loading control. Results are expressed as the mean ± SD of three independent experiments; *P < 0.05 vs. control group; &P < 0.05, vs. cinobufagin group. (D and E) The size of MG-63/U2OS spheroids in the presence of si-OPN. Spheroids were measured when the diameter was > 50 μm. Error bars represent the mean ± SD of three independent experiments. *P < 0.05, vs. control group; &P < 0.05, vs. cinobufagin group. (F) Western blotting was used to determine the protein levels of p-STAT3 Tyr705, p-JAK2 Tyr1007/1008, Bax, Bcl-2, caspase-3 and cleaved PARP,CD133 in MG-63/U2OS spheroids with or without si-OPN. GAPDH was used as a loading control. Results are expressed as the mean ± SD of three independent experiments; *P < 0.05 vs. control group; &P < 0.05, vs. cinobufagin group.

