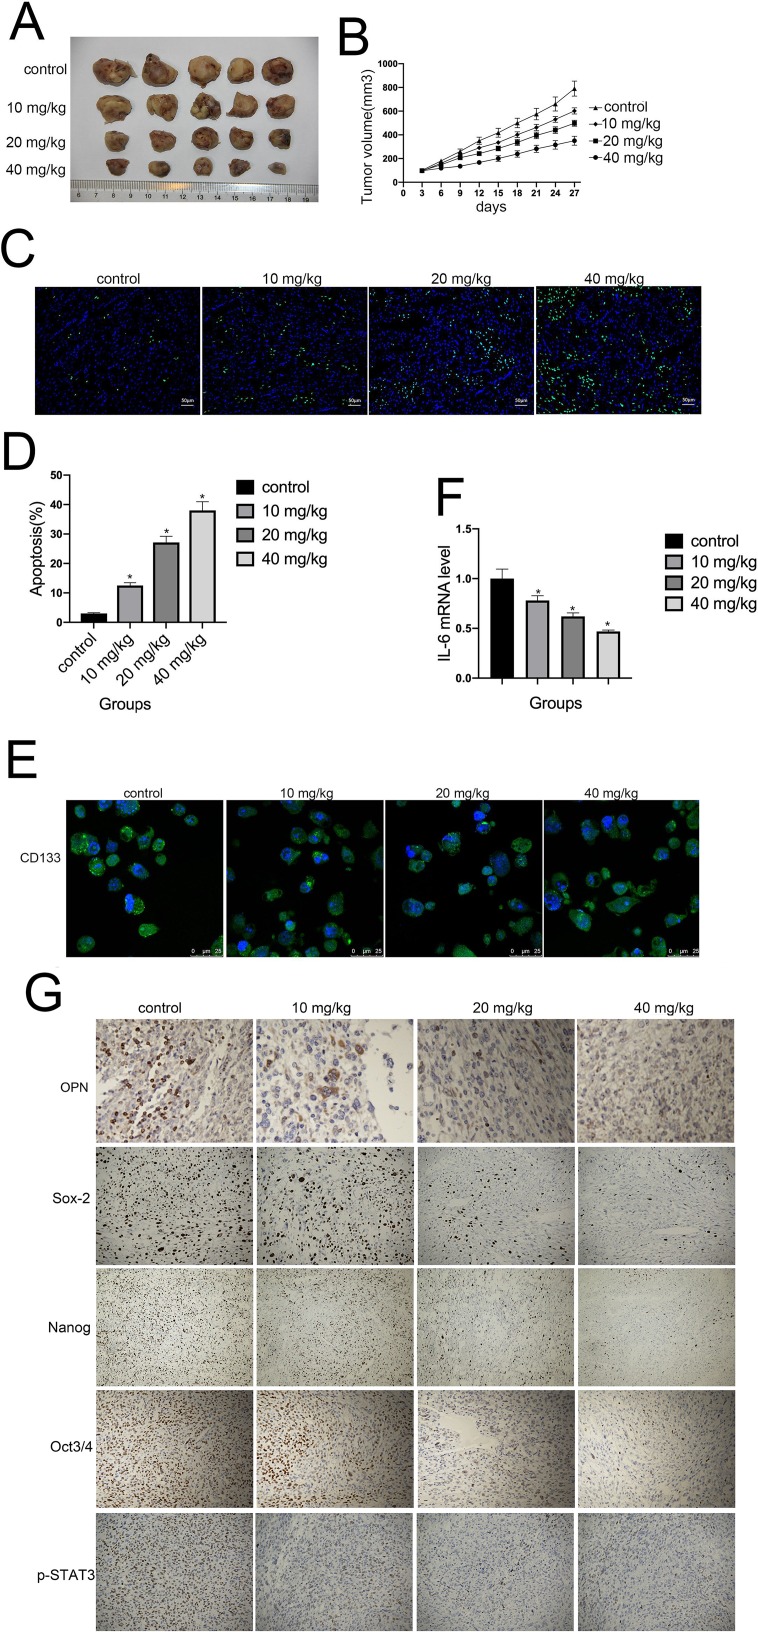
Figure 8.
Cinobufagin inhibited the growth of osteosarcoma xenografts in vivo. (A, B) Changes in tumor volumes in response to different treatments (vehicle, 10, 20, and 40 mg/kg of cinobufagin) in U2OS cells in a xenograft model. Cinobufagin was administered at doses of 10, 20, and 40 mg/kg every 3 days for 4 weeks. Data represent the mean ± SD of the tumor volume and weight of five mice per group. (C, D) TUNEL staining assays were used to estimate the proportion of apoptotic cells in tumor tissues derived from nude mice bearing cinobufagin-treated osteosarcoma-derived CSCs. *P < 0.05. (E) Immunofluorescence staining of CD133 levels in tumor tissues derived from mice bearing osteosarcoma-derived CSCs. (F) Qrt-PCR analysis showing the levels of IL-6 in tumor tissues derived from nude mice bearing cinobufagin-treated osteosarcoma-derived CSCs. *P < 0.05. Results represent the mean ± SD of three independent experiments. (G) Immunohistochemistry analysis showing the levels of OPN, Nanog, Sox-2, Oct3/4 and p-STAT3.Magnification, x400.

