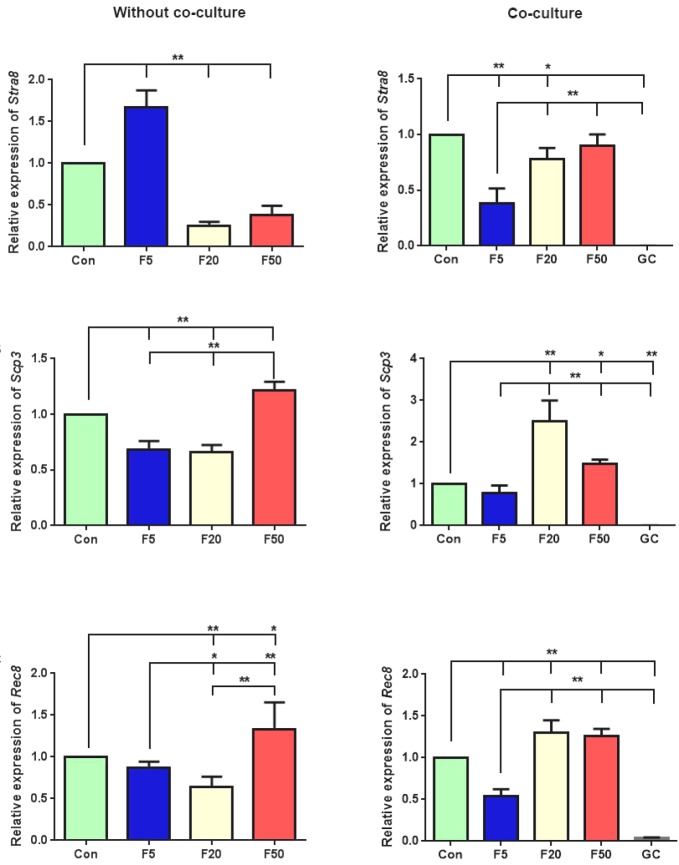
Fig. 3.
Gene expression analysis of meiotic markers, including (A) Stra8, (B) Scp3, (C) Rec8 in differentiated cells after treatment with three different forskolin (F) concentrations (5, 20, and 50 µM), with or without GC co-culture. GCs were cultured alone for controlling these gene expression patterns. Values are means ± SD (n = 3). *p < 0.05, **p < 0.01; Con, control

