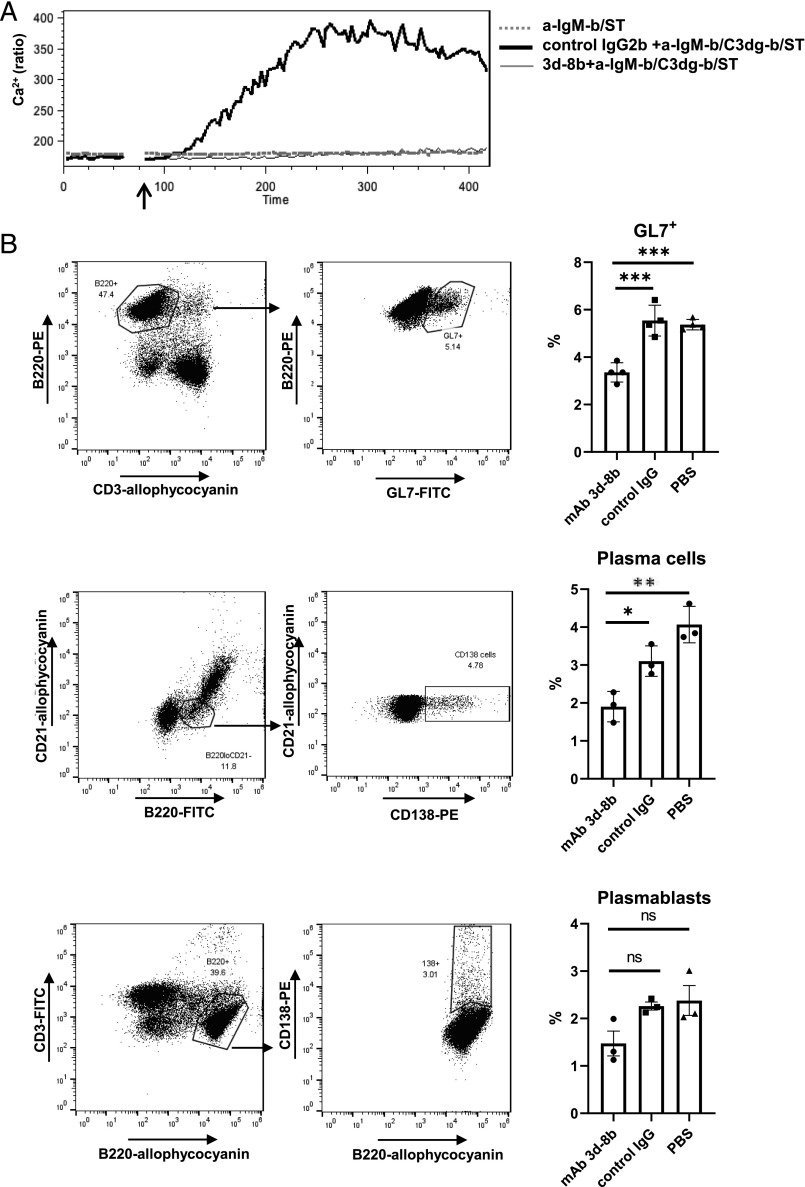
FIGURE 2.
Binding of mAb 3d-8b to C3d blocks CR2 engagement and diminishes B cell– activation signaling. (A) Erythrocyte-depleted splenocytes from B6 mice were loaded with Indo-1 AM and stained with anti-CD45R(B220)–allophycocyanin Ab. The B220+ cells were gated, and the ability to generate Ca2+ influx in response to anti-BCR combined with CR2 ligand (anti–IgM-b/C3dg-b/SA) was analyzed for the B220+ gated cell population. Prior to adding the anti–IgM-b/C3dg-b/SA complex to cells, the complex was preincubated for 2 min with 5 μg/ml mAb 3d-8b to block the CR2 binding site on C3d (thin dark) or isotype control IgG (OVA 11) mAb (thick dark). The suboptimal concentration of anti-IgM Ab alone (anti–IgM-b/SA) was not able to induce Ca2+ influx (dotted gray). The arrow shows the timepoint when stimuli were added to the cells. (B) Injection of mAb 3d-8b interferes with GC formation and B cell transition to Ab-producing cells. B6 mice, three for each condition, were preinjected with 2 mg of mAb 3d-8b, isotype control IgG2b, or PBS. Eighteen hours later, they were immunized with 1 × 10⁸ SRBC per mouse. Eleven days later, splenocytes were isolated and stained with anti-CD3–allophycocyanin and anti-CD45R(B220)–PE as well as the marker for GC cells, GL7-FITC. CD3−/B220+ cells were analyzed for the percentage of GL7+ cells on the B220+ cells (upper row). Plasma cells have a low level of B220 expression and are CR2−. To analyze plasma cell development in mice treated in the three conditions as described above, mice splenocytes were analyzed with anti-CR2–allophycocyanin, anti-CD45R(B220)–FITC and anti-CD138–PE Ab. B220lo and CR2-negative cells were gated, and the percentage of CD138+ cells in B220loCR2− population was calculated in a new plot for CD21–allophycocyanin and CD138-PE (middle row). In contrast to plasma cells, plasmablasts exhibit B220 marker expression similar to mature B cells. To compare the percentage of plasmablasts we have in B cell population, we stained splenocytes with anti-B220–allophycocyanin and anti-CD3–FITC Ab. Gated B220+CD3− cells were reanalyzed for B220+CD138+ cell percentage in a new plot for B220–allophycocyanin and CD138–PE (bottom row). Bars represent average in percentage for GL7+ cells or plasmablasts and plasma cells in spleens of mice from three different conditions. Error bars represent SD for particular group of data. Statistical analyses were performed comparing data obtained for mAb 3d-8b–injected mice to control Ab– or PBS-injected mice. Statistical analyses were performed by one-way ANOVA. *p < 0.05, **p < 0.01, ***p < 0.001. ns, not significant.

