Figure 1.

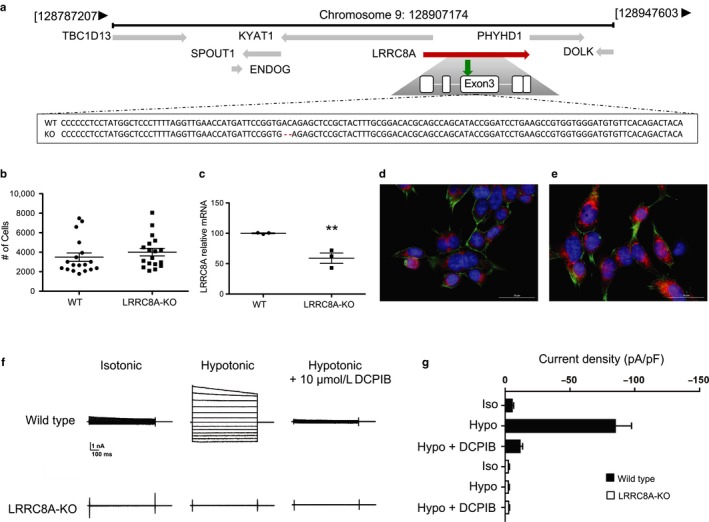
WT and LRRC8A‐KO HAP‐1 cell characterization. Sanger sequencing of WT and LRRC8A‐KO cells confirming location of deleted LRRC8A base pairs (a); surrounding genes include: tre‐2/usp6, BUB2, cdc16 domain family 13 (TBC1D13); Kynurenine aminotransferase 1 (KYAT1); phytanoyl‐CoA dioxigenase domain containing 1 (PHYHD1); SPOUT domain containing methyltrasnferase 1 (SPOUT1); dolichol kinase (DOLK); endonuclease G (ENDOG). Green arrow indicates location of the 2 base pair location (red dash) within exon 3 of the LRRC8A gene (indicated in red). Proliferation rates of both cell types (b) and gene expression of LRRC8A in WT and LRRC8A‐KO and (c). Graphs show mean ± SEM (n = 3); statistical analysis was carried out using student's t‐test. *Indicates p < .05. WT (d) and KO (e) cells stained with Mitotracker (red), phalloidin (green) and Hoechst (blue). Images are taken at 60×, scale bar = 30 microns. (f) Currents were measured by stepping Vm from −120 mV to +120 mV in 20‐mV increments. Cells were exposed to isotonic bath, hypotonic bath, or hypotonic bath +10 µM DCPIB to inhibit VRAC. (g) Mean ± SEM current density at −120 mV from WT and LRRC8A‐KO HAP1 cells measured using a ramp protocol from −120 mV and +120 mV under the indicated bath solution conditions (n = 5)
