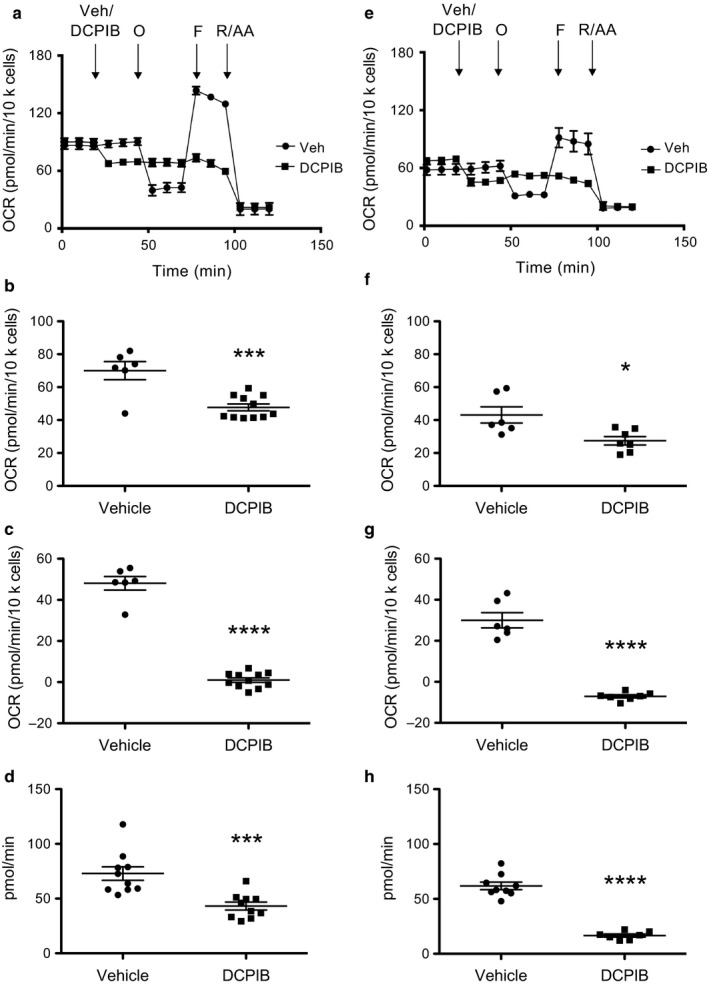
Figure 2.

Mitochondrial respiration in WT and LRRC8A‐KO HAP‐1 cells. Mitochondrial respiration in presence of vehicle (circles) or DCPIB (squares) in WT cells (a) and LRRC8A‐KO cells (e). Basal respiration (WT cells (b) and LRRC8A‐KO cells (f) and ATP‐linked respiration (WT cells (c), LRRC8A‐KO cells (g) were calculated from the mitochondrial respiration graphs. ATP production in WT cells (d) and LRRC8A‐KO cells (h). Graphs show mean ± SEM (n = 3). Statistical analysis was carried out using student's t‐test; * indicates p < .05 compared to vehicle treated cells. O, Oigomycin; F, FCCP; R/AA, rotenone/antimycin A
