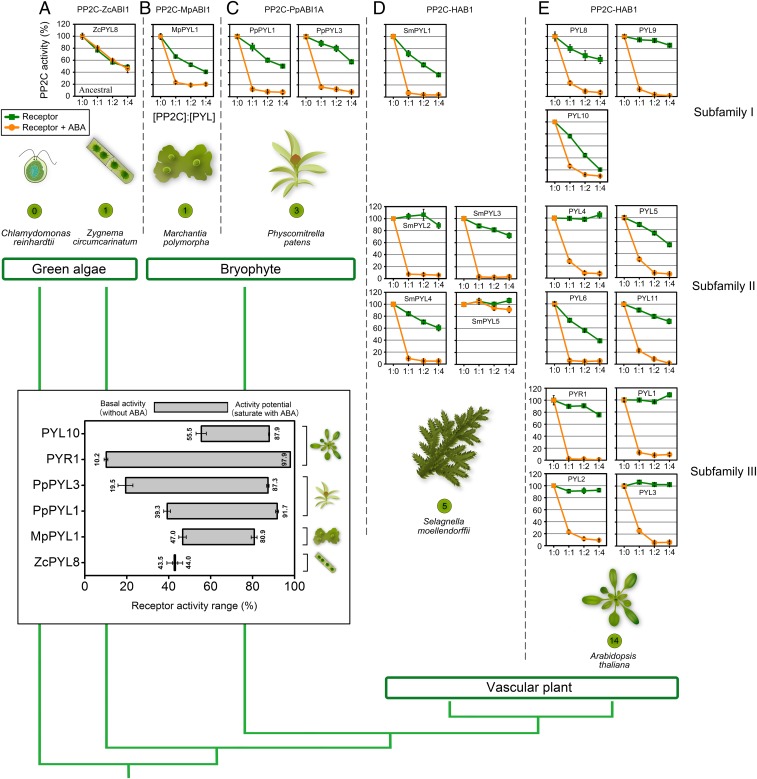
Fig. 1.
Evolution of ABA receptors indicates an increase in ABA dependency as a result of reduction of basal activity. Recombinant 6×His-Sumo-ZcPYL8 (A), 6×His-MpPYL1 (B), PpPYL1, PpPYL3 (C), SmPYL1-5 (D), PYR1, PYL1-6, PYL8, PYL10, MBP-PYL9, and MBP-PYL11 (E) were expressed in E. coli, purified, and used in PP2C activity assays with 6×His-PP2C (ZcABI1, MpABI1, PpABI1A, or HAB1). Reactions were performed with 0.5 μM 6×His-PP2C and varying concentrations of PYL (0, 0.5, 1.0, 2.0 μM) in the absence (green) or presence (orange) of 10 μM ABA. PP2C activity is expressed as percentage of activity of PP2C in the absence of receptor. Graphs plot average values from 3 technical repeats, and error bars indicate SD. Results shown were reproduced with 3 independent protein purifications. Numbers of receptors encoded by corresponding species are shown in green circles. The phylogenetic tree of plant lineages was built according to Bowman et al. (20). The length of the branches does not indicate evolutionary dating. The inserted box depicts the dynamic response range of receptor activity. The numbers on the bar show the range of receptor activity from low at the left (without ABA) to high at the right (saturated with ABA). ZcPYL8 have no activity range. All of the values were captured at 1:2 PP2C:PYL ratio. Plant icons are not to scale.

