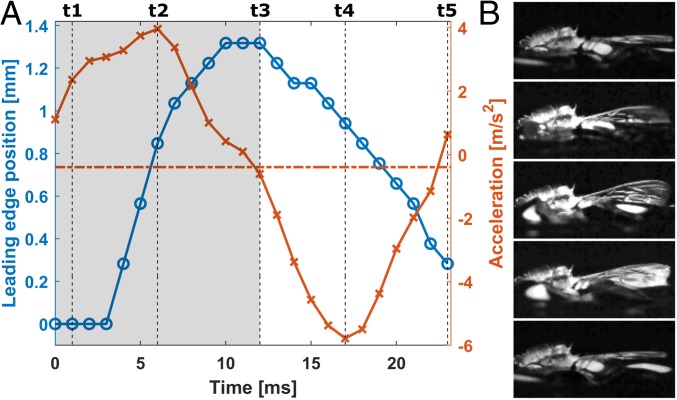
Fig. 3.
Body acceleration and wing kinematics. (A) Leading-edge vertical position and acceleration of the bee’s body. Wing-beat frequency, 44 Hz. Blue −○ line indicates the leading edge vertical position. Red −× line indicates the acceleration. Shaded regions, power stroke phase. Nonshaded region, recovery stroke phase. (B) The wing position corresponding to each time point marked on A; t1–t5, Top to Bottom.

