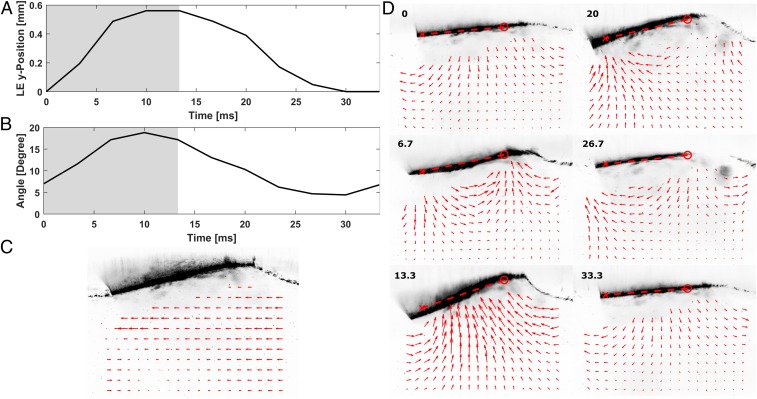
Fig. 5.
Mechanical wing kinematics and resulting flow. (A) Leading edge position. Wing-beat frequency, 30 Hz. Shaded regions, power stroke phase. Nonshaded region, recovery stroke phase. The left corner wing indicates the measurement location, where red circle indicates leading edge. (B) Supination and pronation angle. (C) Time-averaged horizontal velocity over 3 periods. (D) Velocity field under the wing. The black line above the velocity field is the cross-section of the wing. Time stamp at the corner corresponds to the time axis on A and B. See Movie S5 for a full sequence. The red “o” and “x” mark the leading and trailing edges, respectively. An angle that the red dotted line makes with a horizontal axis is the supination/pronation angle.

