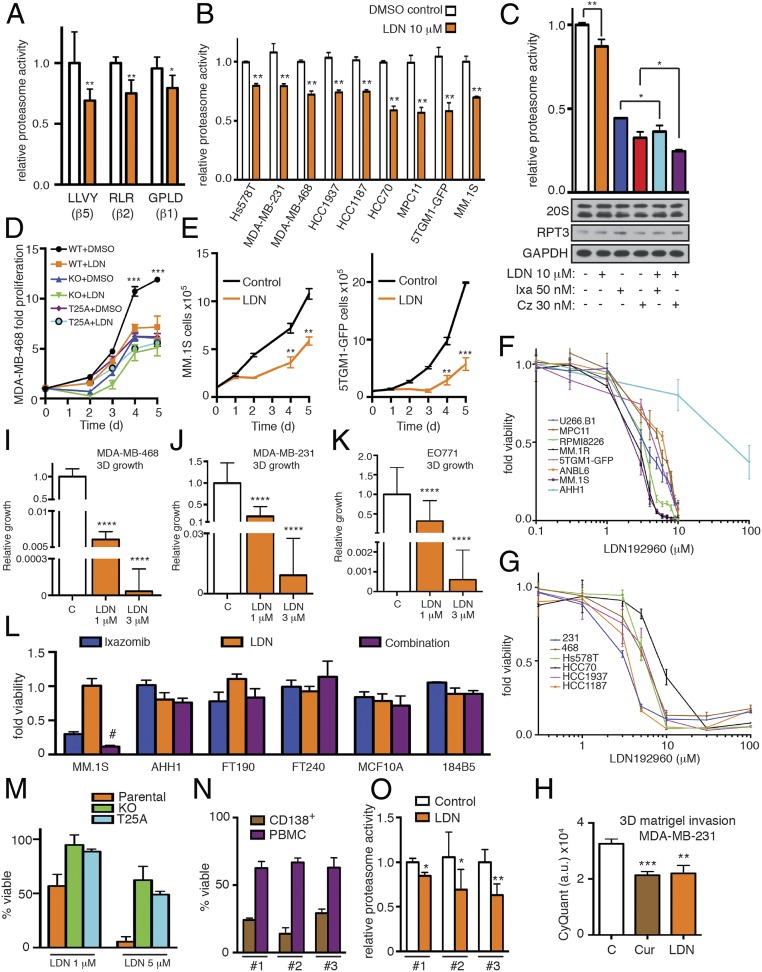
Fig. 4.
LDN192960 perturbs proteasome activity, induces cell death, and impedes proliferation and invasion. (A) Proteasome activity in total cell lysates from MDA-MB-468 cells with or without 10 μM LDN192960 treatment for 2 h was measured with Suc-LLVY-AMC or Ac-RLR-AMC or Ac-GPLD-AMC. *P < 0.05, **P < 0.01 (compared to control treated, 2-tailed paired Student’s t test, mean ± SD from n = 3 biological replicates). (B) Proteasome activity in total cell lysates from the indicated cells with or without 10 μM LDN192960 treatment for 2 h was measured with Suc-LLVY-AMC and normalized to total protein content. **P < 0.01 (compared to control treated for each cell line, ordinary 1-way ANOVA, mean ± SD from n = 3 independent experiments). (C) MDA-MB-231 cells were pretreated with indicated drugs (Ixa, Ixazomib; Cz, Carfilzomib; LDN, LDN192960) for 1 h, and proteasome activity was measured in cell lysates using Suc-LLVY-AMC. **P < 0.01, *P < 0.05 (compared to control treated, ordinary 1-way ANOVA, mean ± SD from n = 3 independent experiments). Immunoblotting of the cell lysates was carried out with indicated antibodies. (D) Fold proliferation of MDA-MB-468 WT, DYRK2 KO, and RPT3 Thr25Ala knock-in cells in presence of DMSO control or 1 μM LDN192960. ***P < 0.001 (2-way ANOVA, mean ± SD from n = 3 biological replicates). (E) Growth curves of MM.1S and 5TGM1-GFP control and LDN192960-treated cells (MM.1S 1 μM and 5TGM1-GFP 3 μM). **P < 0.01, ***P < 0.001 (2-way ANOVA, mean ± SD from n = 3 independent experiments). (F and G) LDN192960 induces cytotoxicity in all myeloma (F) and TNBC (G) tested with EC50 between 6 and 12 μM. Noncancerous AHH-1 cells had >30 µM EC50 for LDN192960. LDN192960 treatment was carried out for 36 h for this experiment. (H) Bar graph depicting cell invasion in a Matrigel transwell migration assay using DMSO treated or 3 μM curcumin or LDN192960-treated MDA-MB-231 cells. Data were acquired 18 h after seeding in upper chamber of 8 μm pore size transwells. Cells that invaded the Matrigel were quantified based on DNA content using CyQuant dye and data represented as arbitrary units (a.u.). **P < 0.01, ***P < 0.001 (compared to DMSO treated, 2-way ANOVA, mean ± SD from n = 2 independent experiments with triplicates in each). (I–K) Growth in 3D culture. MDA-MB-468 (I), MDA-MB-231 (J), and EO771 (K) cells were cultured in 1% methylcellulose for 2 to 4 wk in the presence of DMSO or LDN192960 at 1 or 3 μM. Areas of cell growth were quantified by analysis of images (5 per well). ****P < 0.0001 (compared to DMSO treated, 2-way ANOVA, mean ± SD from n = 2 independent experiments with triplicates in each). (L) Proteasome addicted MM.1S cells and noncancerous AHH1, FT190, FT240, MCF10A, and 184B5 cells were treated with ixazomib alone (MCF10A, 184B5, and MM.1S = 25 nM; FT190, FT240, and AHH1 = 50 nM) or with LDN192960 alone (FT190, FT240, MCF10A, and 184B5 = 5 μM; AHH1 = 10 μM; MM.1S = 3 μM) or the combination of ixazomib and LDN192960 for 24 h, and cell viability was analyzed by CellTiter 96 AQueous Non-Radioactive Cell Proliferation Assay kit. Viability of DMSO-treated cells was utilized as control. Data are represented as fold viability of DMSO-treated control for each cell line (# indicates statistical significance compared to each single drug treatment; 2-way ANOVA with multiple comparison, Fisher’s LSD test) (see also SI Appendix, Fig. S6). (M) MDA-MB-468 parental, DYRK2 KO, and RPT3 Thr25Ala knock-in cells were treated with or without LDN192960 at the indicated concentrations for 48 h. Cell viability was ascertained with CellTiter 96 AQueous Non-Radioactive Cell Proliferation Assay kit. Data were represented as percent viable compared to DMSO-treated cells. (N) Purified primary patient CD138+ myeloma and PBM cells were treated with 3 μM of LDN192960 or DMSO control for 24 h, and cell viability was ascertained with CellTiter 96 AQueous Non-Radioactive Cell Proliferation Assay kit. Data were represented as percent viable compared to DMSO-treated cells (PBMC from ATCC was used as control for patient 1 due to nonavailability of peripheral blood). (O) Proteasome activity in lysates from primary patient CD138+ myeloma cells treated with DMSO or 10 μM LDN192960 for 2 h was measured with Suc-LLVY-AMC. *P < 0.05 (compared to control treated, 2-tailed paired Student’s t test, mean ± SD from n = 3 independent replicates).

