Fig. 2.
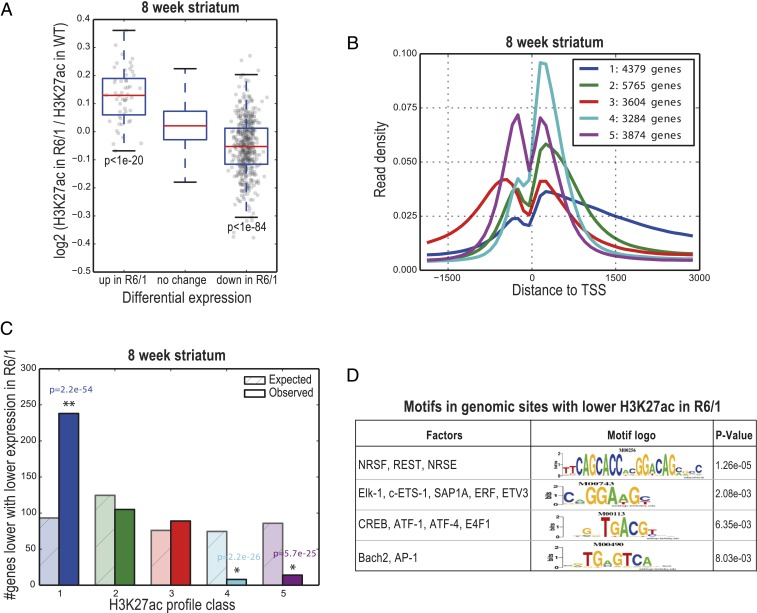
H3K27ac changes coordinately with gene-expression levels, extends into the coding region for genes that are down-regulated in HD, and predicts transcription factors with altered activity in the 8-wk-old R6/1 striatum. (A) Box-and-whisker plot for 8-wk-old R6/1 striatum show the distributions of log2 fold-change of H3K27ac reads in R6/1 compared to wild-type animals (y axis) in a 2,000-bp window around the primary TSS of up- and down-regulated genes in R6/1 mice, as measured by RNA-seq. P values were computed using t test (P < 1e-20, up-regulated vs. no change in expression; P < 1e-84, down-regulated vs. no change in expression). (B) Genes were clustered into 5 groups based on their H3K27ac profiles in the striatum of 8-wk-old wild-type animals. Plots show the density of sequence reads in window from −2 k to +3 kb of the TSS. The Inset shows the number of genes in each class. Genes in class 1 (blue) show a broad peak of H3K27ac starting at the TSS and extending into the coding region. (C) Class 1 is enriched in genes that are expressed at lower levels in R6/1. The numbers of genes with reduced expression expected and observed in each class are shown for 8-wk-old R6/1 striatum. (D) Motif enrichment in genomic regions with lower H3K27ac in R6/1 mice compared to respective wild-type littermates. See also SI Appendix, Fig. S2 and Dataset S7.

