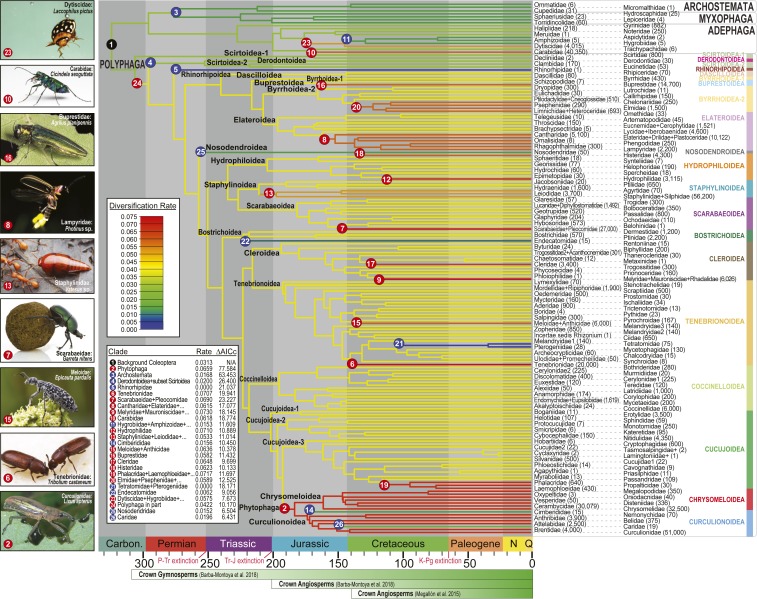
Fig. 2.
Timing and rates of beetle diversification. Family-level net diversification rates and rate shifts for 188/190 beetle families (full tree; SI Appendix, Fig. S10 and Tables S5–S7). Branch colors indicate net diversification rates. Numbered circles indicate the locations of significant net diversification rate shifts (red/increases; blue/decreases). Approximate numbers of described extant species are indicated next to family-level taxon names (76). Note that the right column entries are interdigitated between the left ones, as connected by dashed lines. The beetle suborders and polyphagan beetle superfamilies are labeled on the right side of the tree. Outgroups are not shown. The timeline indicates mass extinctions and significant events in the history of seed plants (39, 77). Photos show select beetle groups that experienced significant diversification rate increases. Lixus image courtesy of D.D.M. Garretes image courtesy of Piotr Naskrecki (Harvard University, Cambridge, MA). Agrilus image courtesy of David Cappaert (photographer). All other photos courtesy of Alex Wild (photographer).

