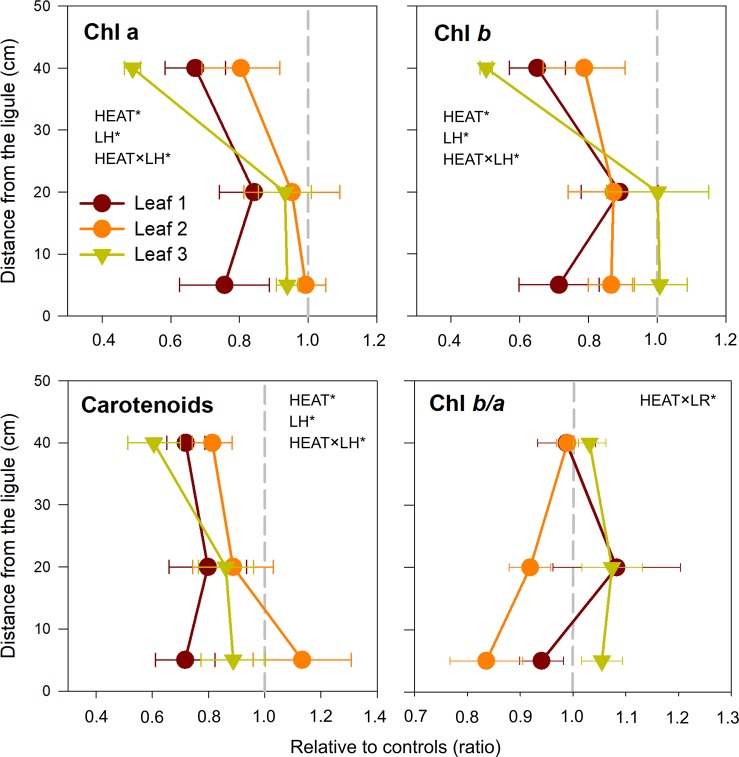
Figure 4.
Changes in chlorophyll a (Chl a), chlorophyll b (Chl b), total carotenoids concentrations, and Chl b/a, in heated relative to control plants (ratio). Values on the left or right of the dashed gray line represent a decrease or increase in respect to controls, respectively. Data are mean ± SE (n = 3). Significant results of three-way analyses of variance are reported on the top of the graphs. For details of SNK post-hoc tests see Table S3.

