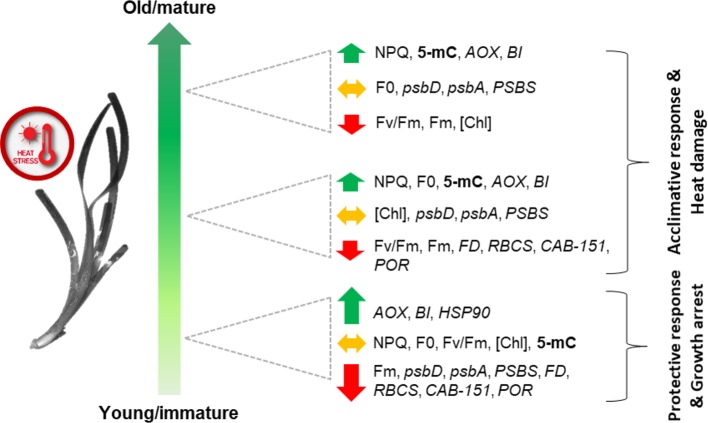
Figure 8.
Schematic (qualitative) representation of main leaf-age related responses of P. oceanica to acute heat stress. Combined responses of both leaf-age gradients (vertical and horizontal) are depicted. Total methylation (5-mC) is in bold; photo-physiological parameters (NPQ, Fv/Fm, F0, Fm, [Chl]) are in regular letters; genes (psbD, psbA, PSBS, FD, RBCS, CAB-151, POR, AOX, BI, and HSP90) are in italics. The length of the arrows reflects the intensity of gene up or down-regulation.

