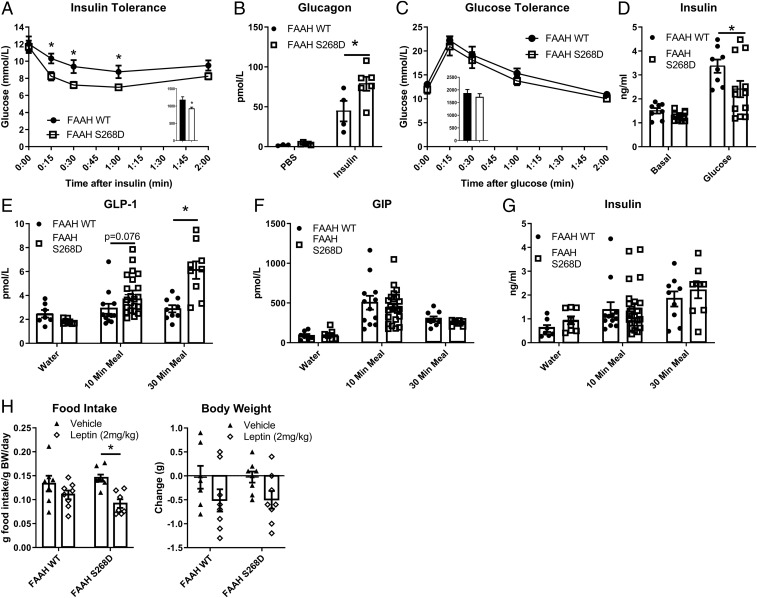
Fig. 2.
Chronic elevation of endogenous NATs improves insulin sensitivity and GLP-1 secretion. (A) Insulin tolerance test (0.5 U/kg) in lean, 7-wk-old males (n = 9 or 10). (B) Plasma glucagon 30 min after i.p. PBS or insulin (n = 3 to 6). (C) Glucose tolerance in lean, 9-wk-old males (n = 6 to 8). (D) Plasma insulin before and 10 min after oral glucose (n = 8 to 12). (E–G) Hormone secretion after oral water or mixed meal (n = 7 to 22). (H) Twenty-four-hour food intake and body weight change after leptin or vehicle (PBS) (n = 7 or 8). Data are presented as mean ± SEM. *P < 0.05 between genotypes within treatment.

