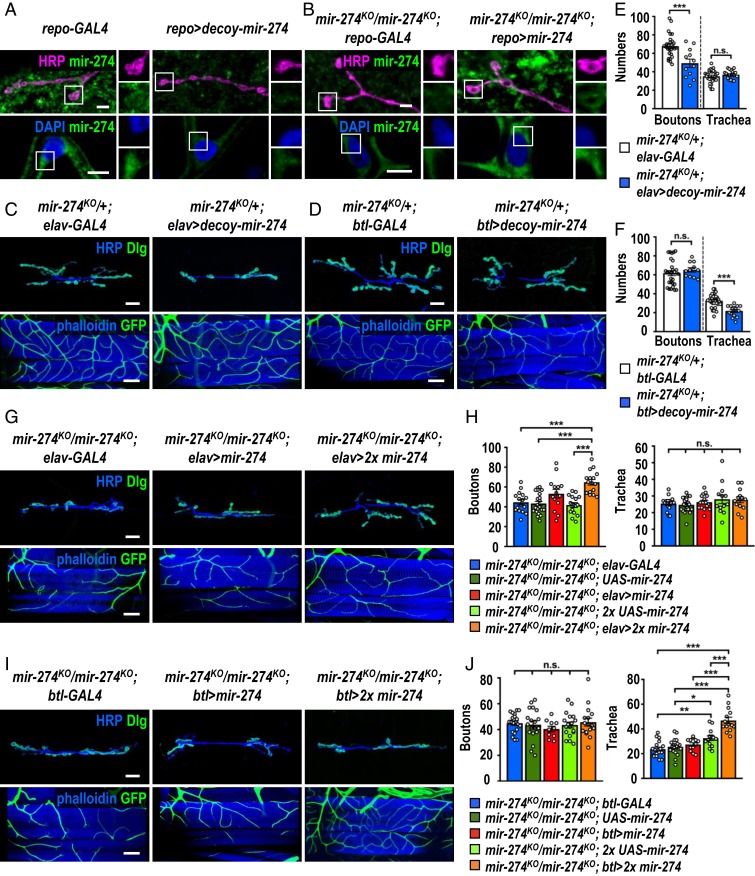
Fig. 4.
Glia-secreted miR-274 localizes and functions in target cells. (A and B) Images show FISH signals in synaptic boutons (Top, scale bars: 5 µm) and tracheal cells (Bottom, scale bar: 10 µm) for the mature miR-274 probe. Bright punctate signals were detected in repo-GAL4 control (A, Left) and the glial rescue mir-274KO/mir-274KO; repo > mir-274 (B, Right), whereas low background signals were presented in glial miR-274 trapping repo > decoy-mir-274 (A, Right) and mutant control mir-274KO/mir-274KO; repo-GAL4 (B, Left). Boxed areas are enlarged at right. (C, D, G, and I) Confocal images show phenotypes in growth of synaptic boutons (Top, scale bars: 30 µm) and tracheal branches (Bottom, scale bars: 60 µm). (C and D) Restricted miR-274 trapping in elav-GAL4-expressing neurons (C, Right) and btl-GAL4-expressing trachea (D, Right) and controls without the trapping decoy-mir-274 transgene (Left). (G and I) Neuronal rescues by elav-GAL4 (G) and tracheal rescues by btl-GAL4 (I) drive 1 copy (Middle) or 2 copies (Right) of UAS-mir-274, compared to GAL4 drivers control without rescuing transgene (Left). (E, F, H, and J) Dotted bar graphs for quantification of synaptic boutons and tracheal branches. See SI Appendix, Table S2. Data were analyzed by independent t test (E and F) or one-way ANOVA followed by Tukey post hoc (H and J). n.s., no significance; *P < 0.05, **P < 0.01, and ***P < 0.001.

