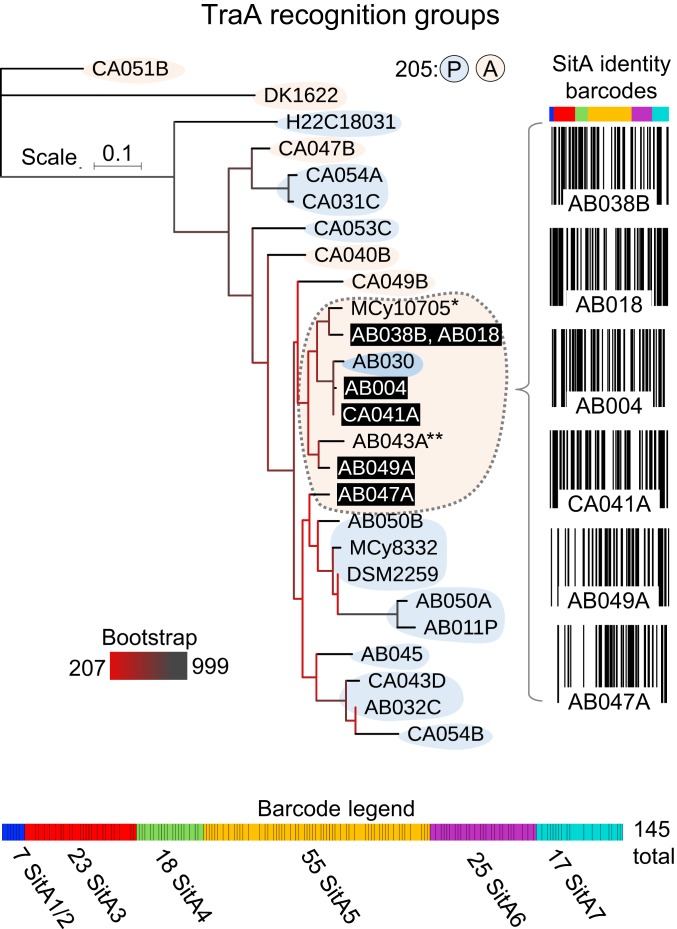
Fig. 7.
SitA loci define molecular barcodes that discriminate kin between cells in a TraA recognition group. TraA and SitA analysis within the Corallococcus genus from Fig. 4. Maximum likelihood tree depicts the relationship between TraA variable domains from 27 genomes. Colored shape backdrops indicate the predicted recognition groups of traA alleles based on their sequence identity and the presence of proline or alanine at relative position 205 as described (3). The largest recognition group is denoted by the dashed outline, excluding the allele with 205P. The 6 available genomes from this group (black bars, white text) encode 224 total sitAI loci, which clustered into 145 distinct groups. Barcode diagrams show the presence (black line) or absence (white line) of each SitA group for the 6 genomes. The barcode legend (Bottom) shows the total sitA loci used to generate the barcodes (color-coded cells separated by black borders). The thickness of each cell is proportional to the number of strains that encode the corresponding locus. *MCy1075 belongs to recognition group 13 (SI Appendix, Fig. S3), but genomic sequence for sitA analysis was not available. **AB043A was not included in recognition group 13 because its VD percent identity fell below the 90% threshold in 4 of 8 cases with other family members.

