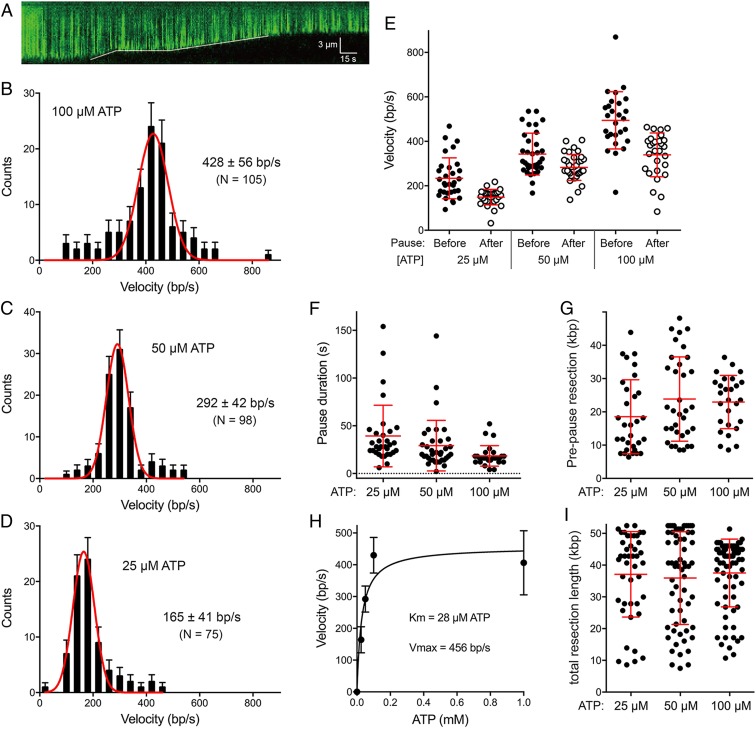
Fig. 7.
Single-molecule DNA curtain analysis of DSB resection by AdnAB. (A) Kymograph showing the resection of YOYO1-stained lambda DNA (green) upon the injection of 5 nM AdnAB within a 1-min injection window. The solid white line indicates the dsDNA end position. (B–D) Velocity distributions of all individual AdnAB resection tracts (including no-pause, before-pause, and after-pause resection tracts) at 100 µM ATP (n = 105) (B), at 50 µM ATP (n = 98) (C), and at 25 µM ATP (n = 75) (D). Black error bars represent 95% confidence intervals calculated from bootstrap analysis. The solid red lines represent Gaussian fits to the data. The mean velocities (±SD) derived from the Gaussian fit are shown in each panel. (E, G, and I) Scatter plots are shown of resection velocities prior to and after AdnAB pausing events (E); AdnAB pause durations (F); resection tract lengths prior to pausing (G); and resection tract lengths at termination (I; a gauge of processivity). Data were collected from DSB resection reactions containing 25 µM ATP (n = 31), 50 µM ATP (n = 34), and 100 µM ATP (n = 27). Red lines indicate the mean and 68% confidence intervals. (H) Plot of resection velocities (with error bars obtained from Gaussian fits) as a function of ATP concentration. The data were fit to the Michaelis–Menten equation, with Km and Vmax values as indicated.

