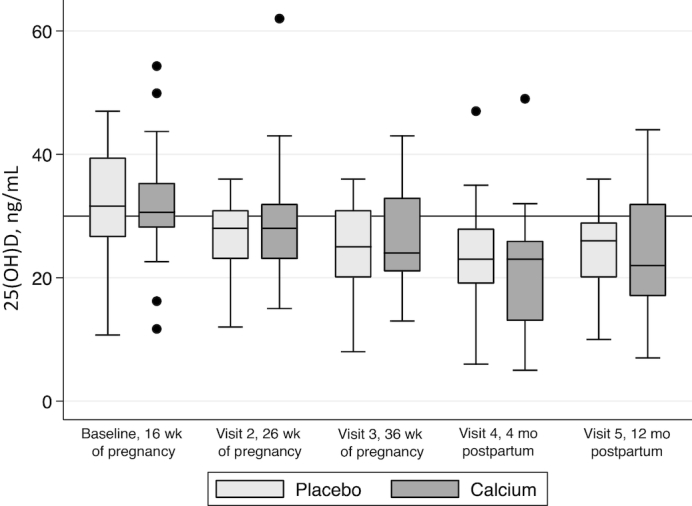
FIGURE 3.

Serum 25(OH)D status from baseline to 12 mo postpartum. In each box plot, the line represents the median, the outside edges of each box represent the IQR, hash marks represent the 5–95% range, and any values outside are represented by single points. 25(OH)D decreased by 17.7% from baseline to 36 wk of gestation and increased slightly postpartum, although 12-mo-postpartum vitamin D concentrations never returned to baseline concentrations (P < 0.001, repeated-measures ANOVA). These changes did not differ by supplementation group. Baseline visit: calcium, n = 32; placebo, n = 32; visit 2: calcium, n = 28; placebo, n = 29; visit 3: calcium, n = 26; placebo, n = 27; visit 4: calcium, n = 22; placebo, n = 23; visit 5: calcium, n = 15; placebo, n = 15. 25(OH)D, 25-hydroxyvitamin D.
