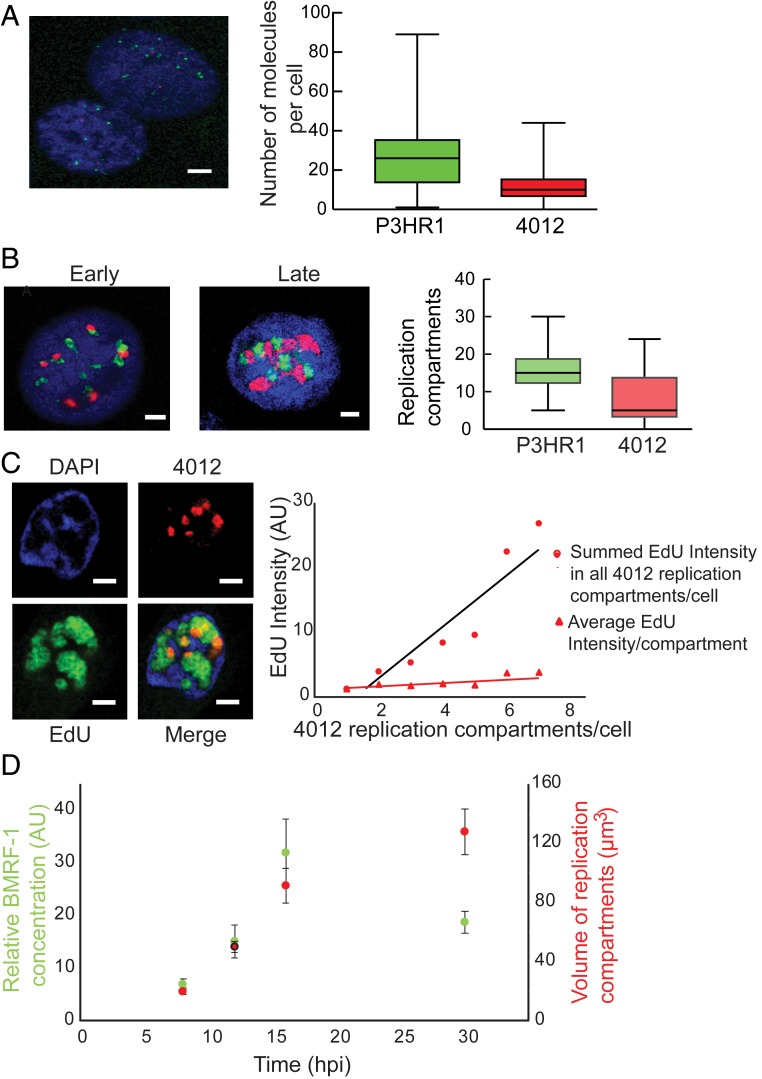
Fig. 5.
Single-cell assays show that the number of replication compartments determine the levels of DNA amplification. (A and B) FISH identifies P3HR1 (green) and 4012 (red) DNAs prior to the onset of the lytic phase in A and during the lytic phase in B. (Scale bars, 5 μm.) (C) Quantitative analysis of 4012 DNA synthesis using EdU pulse labeling and 3D reconstruction (n = 51 cells). On the left is a representative image of a cell containing 4012 compartments in red and undergoing lytic DNA amplification as measured with EdU in green. The chromatin is represented by DAPI in blue. The black line (R2 = 0.88) indicates the average EdU intensity per cell having the indicated number of 4012 compartments on the x axis. The red line (R2 = 0.75) indicates the average EdU intensity per replication compartment in any cell with the indicated number of 4012 compartments on the x axis. Only cells with up to 7 compartments were counted to ensure the accuracy of counting. (Scale bars, 2 µm.) (D) iD98HR1-4012 cells were induced with 200 nM tamoxifen, fixed at the indicated times and probed with anti-BMRF1 antibody. The volumes of the 4012 compartments and the intensities of anti-BMRF1 staining in green were calculated by reconstruction of 4012 compartments (n = 29 to 32 cells; error bars indicate SEM).

