Fig. 6.
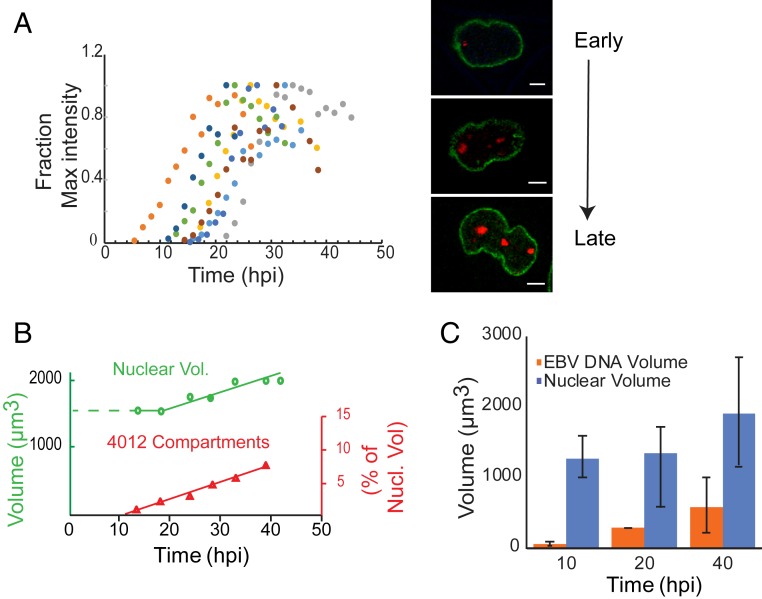
Single-cell assays show spatial and temporal changes in the replication compartments during the lytic phase. (A) iD98R1-4012 cells were induced to enter the lytic phase and followed from 5 to 45 hpi. The replication compartments were then reconstructed and their total intensities were measured. Each colored dot represents the summed intensities of replication compartments in an individual cell at a given time. The fraction of maximum intensity (y) for the sum of all replication compartments for each cell was plotted as a function of time (x). The images on the right represent a single cell going through the lytic phase. Green indicates Lamin A/C-GFP, which marks the nuclear membrane; red indicates LacI-td tomato, which marks the replication compartments. (Scale bars, 5 µm.) (B) The volume of nuclei was measured by measuring the area within the Lamin A/C-GFP boundaries and summed over all of the stacks (0.36 µm per z-stack) for each time point, n = 8 cells. (C) Cells were pulsed with EdU for 30 min at the indicated times after induction and the EdU and chromatin volume (DAPI) were reconstructed for 15 to 20 cells at the indicated times and the volumes were computed.

