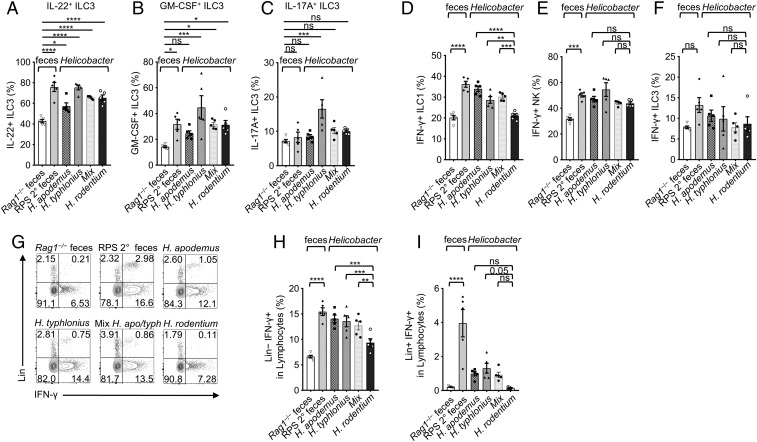
Fig. 6.
H. typhlonius and H. apodemus enhance ILC function. (A) Quantification of IL-22+, (B) GM-CSF+, and (C) IL-17A+ ILC3s frequencies in LI LPLs of mice gavaged with feces or Helicobacter spp.; one-way ANOVA compared to the mean of Rag1‒/‒ control. (D) Quantification of IFN-γ+ ILC1, (E) NK, and (F) ILC3 frequencies after gavage with feces or Helicobacter spp. (G) FACS plots of IFN-γ and Lineage (CD3, CD19, and Ly6g) staining gated on LI LPLs. (H) Quantification of Lin+ and (I) Lin− IFN-γ+ LI LPLs from mice gavaged with feces or Helicobacter spp. Data are pooled from 3 independent experiments (n = 5); one-way ANOVA. Error bars indicate SEM. *P < 0.05, **P < 0.01, ***P < 0.001, ****P < 0.0001; ns, not significant.

