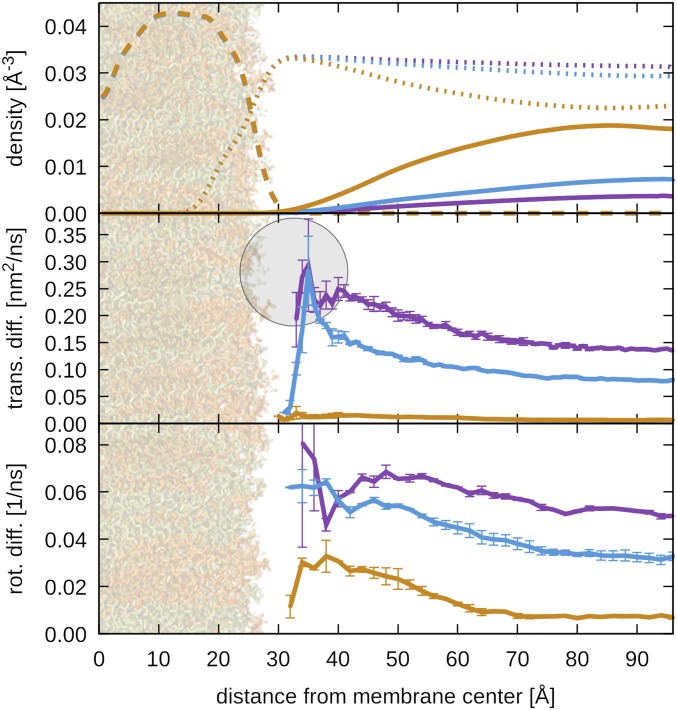
Fig. 3.
Density and diffusion near the membrane. Heavy atom density distributions of molecular components (Top), translational diffusion constants parallel to the membrane (Center), and rotational diffusion constants (Bottom) as a function of the distance from the membrane center along the membrane normal for systems with proteins at 5% (purple), 10% (light blue), and 30% (tan). Densities are shown for proteins (solid lines), lipids (long dashes), and water molecules (short dashes). Translational and rotational diffusion constants were assigned to the center of mass of a given protein at the beginning of the intervals for which mean-square displacements and rotational correlation functions were obtained. Diffusion on shorter time scales, along the membrane normal, and based on mid- or endpoints of diffusion time intervals is shown in SI Appendix, Figs. S26–S28. Translational diffusion was estimated from mean-square displacement vs. time during 10 to 100 ns. Statistical errors for density distributions are less than 1%. The lipid bilayer projected at scale and a gray sphere at the size of protein G at the point of closest membrane contact are shown for perspective.

