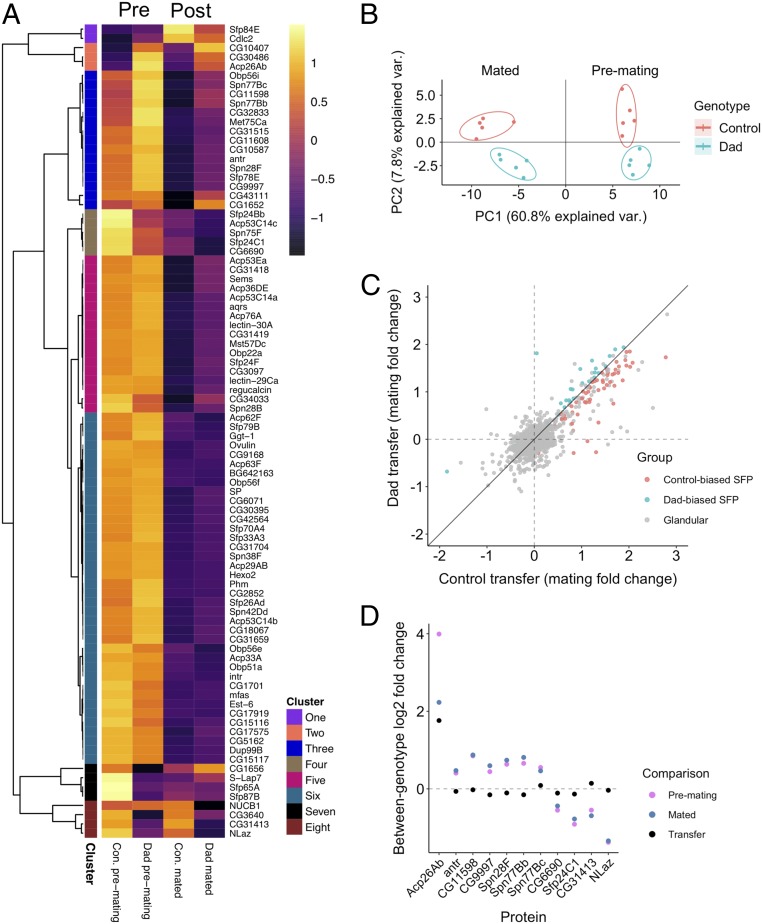
Fig. 4.
Quantitative proteomics reveals remodeling of the SFP proteome in Dad males. (A) A heatmap showing the abundance patterns of SFPs. Columns 1 and 2: males dissected prior to mating; columns 3 and 4: males dissected 25 min after mating. Columns 1 and 3: control males; columns 2 and 4: Dad males. Row annotations highlight membership of higher-order clusters based on a Pearson correlation distance metric. (B) Output of a PCA conducted on abundances of the 88 detected SFPs. Points colored according to male genotype. Mated glands are on the Left, premating glands on the Right of x = 0 line. Ellipses denote 80% normal probability. (C) Correlation between Dad and control pre- vs. postmating fold changes (degree of transfer) for each SFP. Red gives SFPs transferred in greater quantities by control males, blue gives SFPs transferred in greater quantities by Dad males. Gray denotes glandular proteins (i.e., non-SFPs). (D) Log2 fold changes for 3 different between-genotype comparisons for each of 11 SFPs identified as showing a significant abundance change in response to BMP signaling suppression. Comparisons: premating (pink), postmating (blue), and transfer to females (black). Positive values indicate greater abundance in Dads.

