Fig. 2.
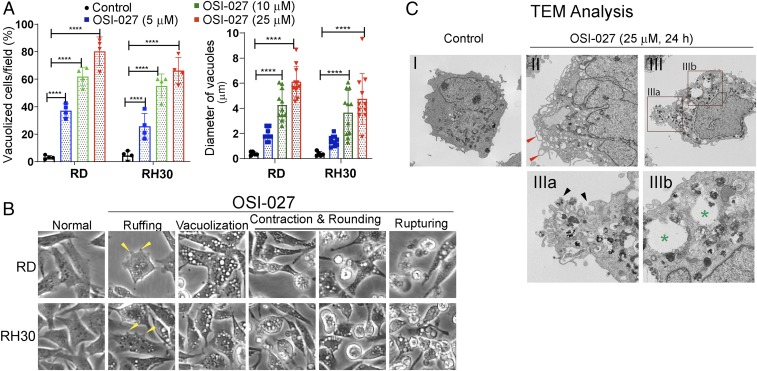
OSI-027 induced dramatic phenotypic changes in RMS cells. (A) Concentration-dependent effects of OSI-027 (5 to 25 µM, 24 h) on the quantification (%) of vacuolized cells and average sizes of the vacuoles. Four or 5 different fields with 50 to 100 cells/field for each treatment were counted. ****P < 0.0001 compared with controls. This experiment is typical of 3 biological replicates. (B) Representative phase-contrast images showing ruffling (yellow arrows), vacuolization, contraction, rounding, and rupturing in OSI-027–treated RD or RH30 cells (see also SI Appendix, Fig. S1 C, and Movie). (Magnification: 100×.) (C) Representative TEM images of vehicle-treated (control) and OSI-027–treated (25 µM, 24 h) RD cells. I, control RD cells displaying well-maintained cytoplasmic compartments. II and III, OSI-027–treated cells showing massive vacuolization and degraded cytoplasmic compartments. In II, red arrows indicate the formation of plasma membrane-bound vacuoles and irregular protrusion compared with untreated plasma membrane cell surface. In III, a, black arrows indicate surface membrane invaginations formed crater-like cups. (Magnification: C-I, II, and III, 1,100×; C-IIIa, 2,100×; C-IIIb, 4,400×.) OSI-027–induced vacuoles varied in size and appeared mostly empty bound by single membrane (green asterisks in III and III, b).

