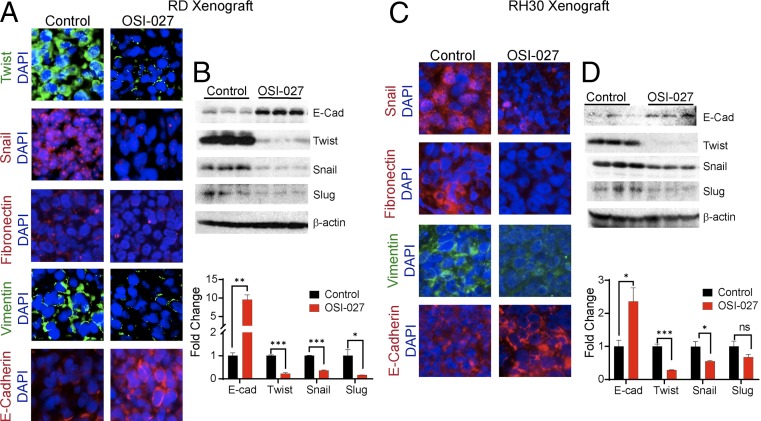
Fig. 8.
OSI-027 down-regulates the expression of biomarkers of EMT in RMS xenograft tumors. (A and C) Immunofluorescence staining of Twist, Snail, Fibronectin, Vimentin, and E-cadherin (E-cad) in vehicle- or OSI-027–treated RMS cell-derived xenograft tumors harvested on day 33 for RD or on day 21 for RH30. (Magnification: 400×.) (B and D) Immunoblot analysis of E-cadherin (E-Cad), Twist, Snail, and Slug in tumor lysates obtained from vehicle- and OSI-027–treated animals on termination of the experiment. The histogram shows a densitometry analysis of immunoblot band intensity. *P < 0.05; **P < 0.01; ***P < 0.001 compared with their respective controls. ns, nonsignificant. Each set of data represents n = 3.

