Figure 3.
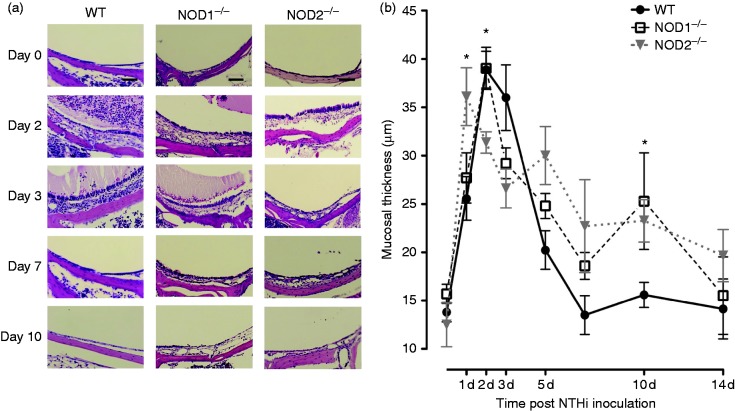
(a) Representative micrographs of the MEs mucosal responses of WT, NOD1−/−, and NOD2−/− mice during OM time course. The MEs of all three strains demonstrated a very thin mucosal layer and no cellular infiltrate in the ME cavity before NTHi inoculation. By d 2 and 3 after inoculation, the MEs of WT and NOD1−/− mice were infiltrated by inflammatory cells and effusion with squamous hyperplasia, while NOD2−/− mice showed fewer ME leukocytes and delayed mucosal hyperplasia. Scale bars represent 50 µm. (b) A quantitative evaluation of mucosal thickness of the ME cavity throughout the course of OM. The MEs of WT, NOD1−/−, NOD2−/− mice showed similar degrees of mucosal thickness on d 1 but a thinner mucosa was evident on d 2 for NOD2−/− mice. The mucosal layer of WT mice returned to basal thickness by d 7, meanwhile on d 10, the mucosa of NOD1−/− and NOD2−/− mice was still thicker than that of WT animals.

